Unlock a world of possibilities! Login now and discover the exclusive benefits awaiting you.
- Qlik Community
- :
- All Forums
- :
- QlikView App Dev
- :
- Replicate excel pivot table in qlikview
- Subscribe to RSS Feed
- Mark Topic as New
- Mark Topic as Read
- Float this Topic for Current User
- Bookmark
- Subscribe
- Mute
- Printer Friendly Page
- Mark as New
- Bookmark
- Subscribe
- Mute
- Subscribe to RSS Feed
- Permalink
- Report Inappropriate Content
Replicate excel pivot table in qlikview
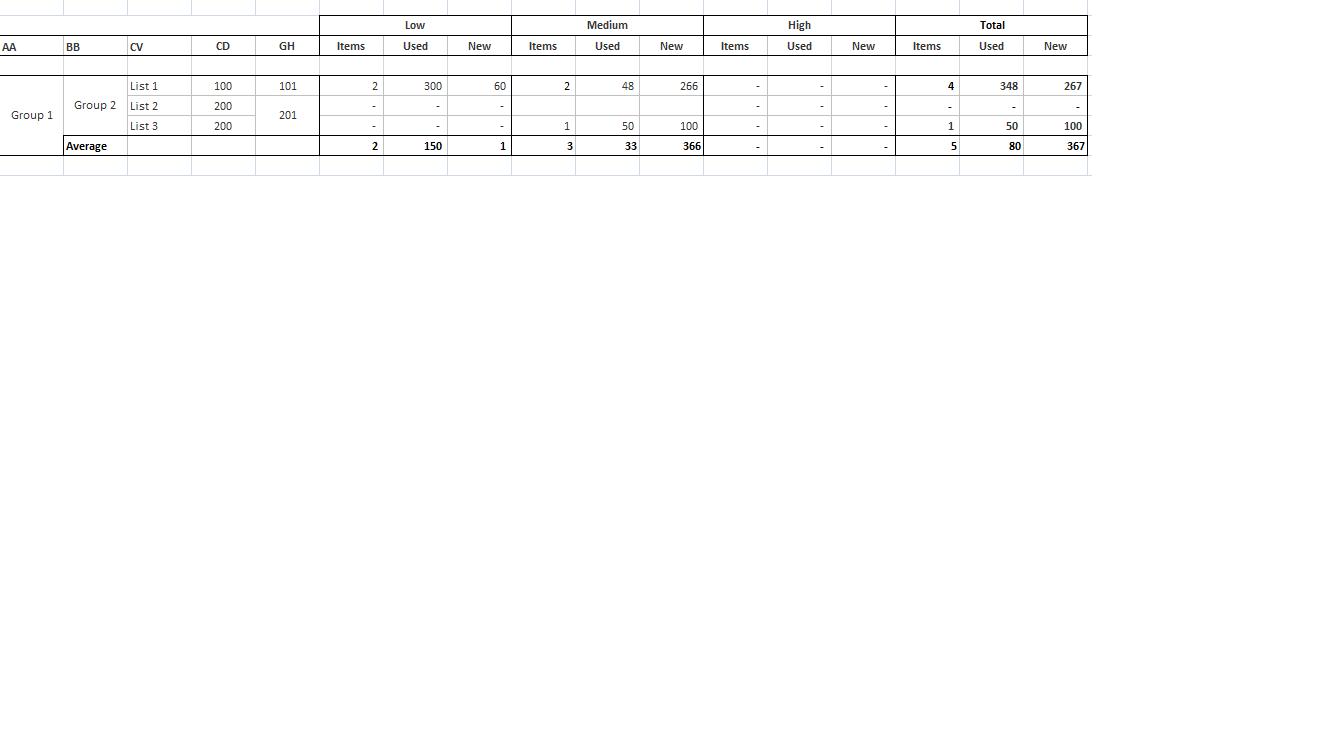
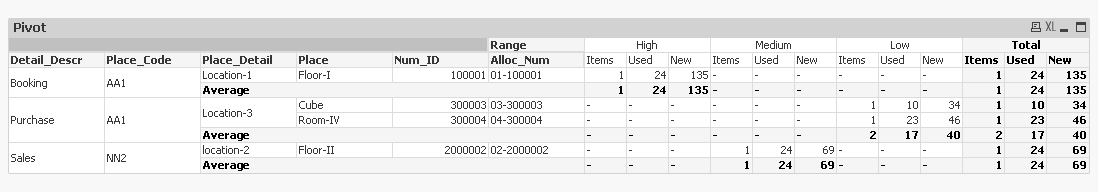
I have a Pivot table format in Excel (Please see the attached .jpg file) and I would like to replicate same format in Qlikview pivot table. If I can replicate it in Qlikview then I can auto generate the reports into excel without any VBA coding on excel side.
The Low, Medium and High which are shown in the screen shot are not available in qlikview as dimension and I need to create them based on the below logic:
If New <=60 Then "Low"
If New > 60 and <=300 Then "Meduim"
If New >300 Then "High"
Can this be done and how..
Thanks
- « Previous Replies
-
- 1
- 2
- Next Replies »
Accepted Solutions
- Mark as New
- Bookmark
- Subscribe
- Mute
- Subscribe to RSS Feed
- Permalink
- Report Inappropriate Content
Use a sort expression for the Range Dimension:
=Match(Aggr(If(avg(Aggr(Sum(MFrontTrips)/2,Detail_Descr,Place_Code,Place_Detail,Place,Num_ID,Alloc_Num)) <=60,'Low',
If(avg(Aggr(Sum(MFrontTrips)/2,Detail_Descr,Place_Code,Place_Detail,Place,Num_ID,Alloc_Num)) > 60 And avg(Aggr(Sum(MFrontTrips)/2,Detail_Descr,Place_Code,Place_Detail,Place,Num_ID,Alloc_Num)) <=100,'Medium',
If(avg(Aggr(Sum(MFrontTrips)/2,Detail_Descr,Place_Code,Place_Detail,Place,Num_ID,Alloc_Num)) > 100,'High'))),Detail_Descr,Place_Code,Place_Detail,Place,Num_ID,Alloc_Num),
'Low', 'Medium', 'High')
- Mark as New
- Bookmark
- Subscribe
- Mute
- Subscribe to RSS Feed
- Permalink
- Report Inappropriate Content
Can you share the raw data to be able to replicate what you have in the image?
- Mark as New
- Bookmark
- Subscribe
- Mute
- Subscribe to RSS Feed
- Permalink
- Report Inappropriate Content
I am able to put together a sample of raw data for your use and here is the list below:
1) Pivot_Source_Data.xlsx
2) Pivot_Dashboard.qvw
3) Pivot_Output_Format.xlsx
Hope this helps...
- Mark as New
- Bookmark
- Subscribe
- Mute
- Subscribe to RSS Feed
- Permalink
- Report Inappropriate Content
This?
- Mark as New
- Bookmark
- Subscribe
- Mute
- Subscribe to RSS Feed
- Permalink
- Report Inappropriate Content
I see that you created a field called "column' and then creating the pivot. In my case the data is dynamic and it should be calculated in the expressions, because the user will be selecting around 10 filters before exporting this pivot to Excel. Also at the total level I need to do averages. Because the data is confidential I created the source data in a simple table for this exercise. Do you think it can be done using Expressions and Dimensions on the fly...
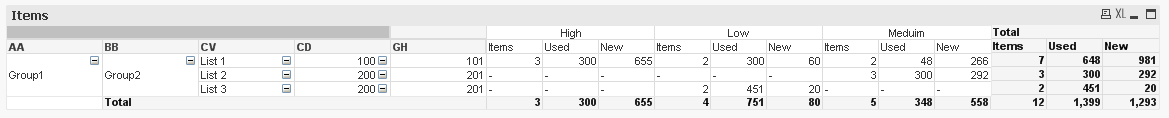
I am trying to use the below formulas in the expressions and trying to get it into the format: ( I am able to get the values)
=Count (AA) <--------------- Items
=avg(Aggr(count(Used),AA,BB,CV,CD,GH)) <----------- Used
=avg(Aggr(Sum(New)/72,AA,BB,CV,CD,GH)) <-------------- New
But not able to replicate the formula in the dimension to bucket them as Low, Medium and High,,,,
- Mark as New
- Bookmark
- Subscribe
- Mute
- Subscribe to RSS Feed
- Permalink
- Report Inappropriate Content
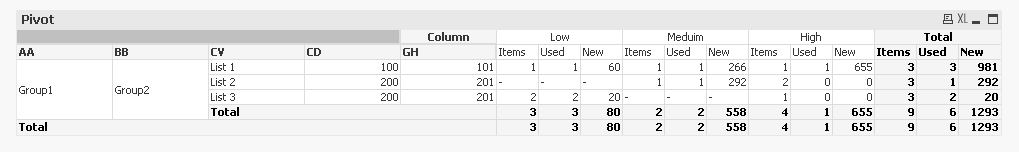
We can only show the table as per your requirement as,
As per my understanding it is not possible to fit your requirement in single pivot table. Means you want sum/count of Items, Used, New at High,Low, Medium level and Avg at subtotal level.
- Mark as New
- Bookmark
- Subscribe
- Mute
- Subscribe to RSS Feed
- Permalink
- Report Inappropriate Content
So you are saying that New is not a number coming from the database, but a calculation that takes place on the front end of the application?
Would it be possible to share dummy data which matches the row format of your actual data?
- Mark as New
- Bookmark
- Subscribe
- Mute
- Subscribe to RSS Feed
- Permalink
- Report Inappropriate Content
That is correct..
I tried to put something together which is almost close to the original and hope this is what you are looking for:
1) Source_Data.xlsx
2) Pivot_Dashboard.qvw
3) Pivot_Output_Format_Ver_2.xlsx
Logic for Low/Medium/High:
If New <=60 Then "Low"
If New > 60 and <=100 Then "Meduim"
If New >100 Then "High"
In the dashboard I was able to get the low/medium/high as a Expression but want to see if we can get it as Dimension.
Thanks
- Mark as New
- Bookmark
- Subscribe
- Mute
- Subscribe to RSS Feed
- Permalink
- Report Inappropriate Content
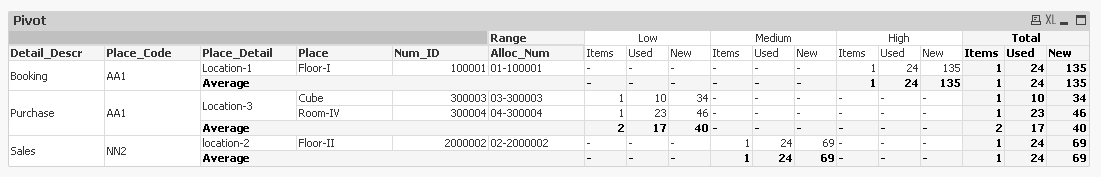
Check the attached
Calculated Dimension for High/Medium/Low:
=Aggr(If(avg(Aggr(Sum(MFrontTrips)/2,Detail_Descr,Place_Code,Place_Detail,Place,Num_ID,Alloc_Num)) <=60,'Low',
If(avg(Aggr(Sum(MFrontTrips)/2,Detail_Descr,Place_Code,Place_Detail,Place,Num_ID,Alloc_Num)) > 60 And avg(Aggr(Sum(MFrontTrips)/2,Detail_Descr,Place_Code,Place_Detail,Place,Num_ID,Alloc_Num)) <=100,'Medium',
If(avg(Aggr(Sum(MFrontTrips)/2,Detail_Descr,Place_Code,Place_Detail,Place,Num_ID,Alloc_Num)) > 100,'High'))),Detail_Descr,Place_Code,Place_Detail,Place,Num_ID,Alloc_Num)
- Mark as New
- Bookmark
- Subscribe
- Mute
- Subscribe to RSS Feed
- Permalink
- Report Inappropriate Content
Can we get the columns Low, Medium and High in order. Meaning the columns are showing as High, Medium, Low and it has to be Low, Medium, High.
Also as shown in the output format file, I need the Total columns to the right of the pivot table.
I think we are almost there....
- « Previous Replies
-
- 1
- 2
- Next Replies »