Unlock a world of possibilities! Login now and discover the exclusive benefits awaiting you.
- Qlik Community
- :
- All Forums
- :
- QlikView App Dev
- :
- Re: Return a field value over Max(date)
- Subscribe to RSS Feed
- Mark Topic as New
- Mark Topic as Read
- Float this Topic for Current User
- Bookmark
- Subscribe
- Mute
- Printer Friendly Page
- Mark as New
- Bookmark
- Subscribe
- Mute
- Subscribe to RSS Feed
- Permalink
- Report Inappropriate Content
Return a field value over Max(date)
Hi all
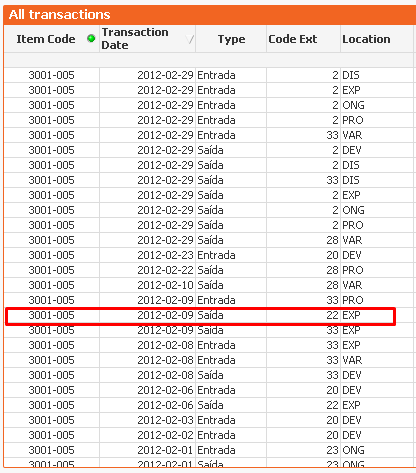
I have a Qlik table with all itens transactions records like this sample:
And I want a analysis with these Layout:
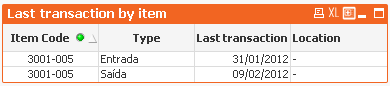
Where Last transaction is a calculated dimension with this expression:
=Aggr(Max({<CODE_EXT={'21','22'}>} DATE_TRANSACTION), COD_ITEM, TYPE)
I need Location shows the correctly value for a combination of Item Code, Type and Transaction Date, but I couldn't find an expression that fits. Tried a simple =CODE_LOCATION, but without success.
If someone need the qvw code, I can put this later.
Tks for suggestions!
- « Previous Replies
-
- 1
- 2
- Next Replies »
- Mark as New
- Bookmark
- Subscribe
- Mute
- Subscribe to RSS Feed
- Permalink
- Report Inappropriate Content
Tks guys. That's FirstSortedValue() was the function that I needed.
Never used it before, and now I learned a new one. 
Just to discuss a bit more for performance purposes and best practices.
We have 2 basics ways to do that.
In Vishwarath suggestion, the first parameter have only a field, but in Aggr() we need to add the CODE_EXT field.
= FirstSortedValue(CODE_LOCATION, -Aggr(Max({<CODE_EXT={'21','22'} >} DATE_TRANSACTION), COD_ITEM,TYPE, CODE_EXT))
In Sunny suggestion, the set analysis shows again into first parameter, but the Aggr() have one field less to group.
=FirstSortedValue({<CODE_EXT={'21','22'}>} CODE_LOCATION, -Aggr(Max({<CODE_EXT={'21','22'} >} DATE_TRANSACTION), COD_ITEM, TYPE))
Someone could evaluate which one cost less, and why?
In my app, i have almost 10 million of transaction records, and the performance is something i have to consider to make qvw fast.
I believe the first one cost less, because the processing are made once in Aggr(), and FirstSortedValue() have only to shows CODE_LOCATION without processing, but with the experts opinions like you guys, I'm feel more comfortable to decide.
- Mark as New
- Bookmark
- Subscribe
- Mute
- Subscribe to RSS Feed
- Permalink
- Report Inappropriate Content
Tks for suggestion Sasidhar, it worked too. But this solutions don't looks simple enough to this simple problem, and could sounds a bit confuse to others developers in case of maintaining the app code.
I appreciated your time to help me with this issue. 
- Mark as New
- Bookmark
- Subscribe
- Mute
- Subscribe to RSS Feed
- Permalink
- Report Inappropriate Content
In my opinion, the second one might work better.... but I have not done any testing to prove it. The reason I think it will work better is because Aggr() function creates an imaginary table with the dimensions you list in the Aggr() function. The imaginary table is similar to a straight table and which one do you think will render faster in a straight table
1) 3 dimensions
2) 2 dimensions
I think 2 dimensions will perform at least as good as 3 dimensions if not better....
Again, I have not done any testing to prove that this is right, but may be hic, rwunderlich, troyansky, or marcus_sommer can share there opinions.
Best,
Sunny
- Mark as New
- Bookmark
- Subscribe
- Mute
- Subscribe to RSS Feed
- Permalink
- Report Inappropriate Content
Yes, I will make the tests right now, and will post here the results.
The point you mentioned is valid, no doubt about the Aggr with 2 dimensions will performing better, but besides that, we have one extra calculation step in FirstSortedValue() function, the evaluate of set analysis again.
That was the point that brings me the question, but your argument convinces me.
Soon I will come back with real tests results, that should support our discussion.
- Mark as New
- Bookmark
- Subscribe
- Mute
- Subscribe to RSS Feed
- Permalink
- Report Inappropriate Content
Set analysis is evaluated once per chart.... so in my opinion, it shouldn't be taxing enough to offset the use of 2 dimensions.... but if you are doing some tests, I would be eager to know which one worked better.
- Mark as New
- Bookmark
- Subscribe
- Mute
- Subscribe to RSS Feed
- Permalink
- Report Inappropriate Content
I did not go through the entire discussion. Therefore, I might be wrong missing some. I was wondering if a simpler expression could work.
FirstSortedValue({<CODE_EXT={'21','22'}>} CODE_LOCATION, -DATE_TRANSACTION)
Since, you are using the set analysis in firstsortedvalue() already, the DATE_TRANSACTION would consider the filter before sorting them, hence an additional aggr() and max() might not be required (the aggregation at dimensions are already happening since they are there in the chart as dimensions).
And yes, the third calculated dimension should probably be used as an expression (Max({<CODE_EXT={'21','22'}>} date(DATE_TRANSACTION))) that could again help do away with aggr().
- Mark as New
- Bookmark
- Subscribe
- Mute
- Subscribe to RSS Feed
- Permalink
- Report Inappropriate Content
Hummm....
Is very good to know Set Analysis evaluated once per chart. So, i think this make simple the comparison of the expressions.
With 1 set analysis and Aggr() with 3 dimensions: 7.88 seconds to render.
With 2 set analysis and Aggr() with 2 dimensions: 2.70 seconds to render.
Tks so much for discussion. Always nice learn with experienced ones.
I think there's no loose ends in this issue.
- Mark as New
- Bookmark
- Subscribe
- Mute
- Subscribe to RSS Feed
- Permalink
- Report Inappropriate Content
But you might have had a winner in tresesco's expression... I have not checked it... but what he mentioned makes sense to me and should perform better then either of the two above
- Mark as New
- Bookmark
- Subscribe
- Mute
- Subscribe to RSS Feed
- Permalink
- Report Inappropriate Content
Yes... for me too.
- Mark as New
- Bookmark
- Subscribe
- Mute
- Subscribe to RSS Feed
- Permalink
- Report Inappropriate Content
Totally sense.
Once DATE_TRANSACTION will consider the filter, no need to use Aggr() with other stuffs.
Perfect.
Tks for advice!
- « Previous Replies
-
- 1
- 2
- Next Replies »