Unlock a world of possibilities! Login now and discover the exclusive benefits awaiting you.
- Qlik Community
- :
- All Forums
- :
- QlikView App Dev
- :
- Re: Rolling 12 months
- Subscribe to RSS Feed
- Mark Topic as New
- Mark Topic as Read
- Float this Topic for Current User
- Bookmark
- Subscribe
- Mute
- Printer Friendly Page
- Mark as New
- Bookmark
- Subscribe
- Mute
- Subscribe to RSS Feed
- Permalink
- Report Inappropriate Content
Rolling 12 months
I have just started to use QW and would like someone to help me 😉
I have a date field "WEXAM_CREATED_DATE" that has the format: DD-MM-YYY HH:MM:SS and a number of examinations "count(type)" that occurs that day. (e.g. 124 as a count sum)
I would like to have a 12 months rolling figure that shows the count / sum of "count(type)" for the "WEXAM_CREATED_DATE" and the last 12 months.
I have just started to use QW and would like someone to help me 😉
Søren
- Mark as New
- Bookmark
- Subscribe
- Mute
- Subscribe to RSS Feed
- Permalink
- Report Inappropriate Content
Try using accumulation if you are using bar chart.
For doing in chart follow this
- Mark as New
- Bookmark
- Subscribe
- Mute
- Subscribe to RSS Feed
- Permalink
- Report Inappropriate Content
Use this thread to rolling in script
- Mark as New
- Bookmark
- Subscribe
- Mute
- Subscribe to RSS Feed
- Permalink
- Report Inappropriate Content
I am not quite sure if I have explained myself correct.
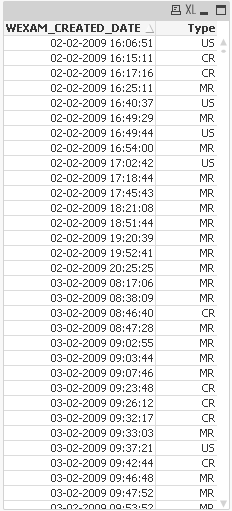
I have a table as this:
My wish is to have two calculations done
1. Count the number of "Type" per day as Count(Type) and display it as total "Count(Type) in e.g. July 2014.
2. Count the number of "Type" per day as above, BUT as a sum of the last 12 months calculated from e.g. July 2014 (the period: June 2013 till July 2014)
Result (table)

- Mark as New
- Bookmark
- Subscribe
- Mute
- Subscribe to RSS Feed
- Permalink
- Report Inappropriate Content
Hi Soren!
Please, could you export to excel this table of your aplication and attach here? Or attach a reduced data QVW file?
Best regards,
Marcello