Unlock a world of possibilities! Login now and discover the exclusive benefits awaiting you.
- Qlik Community
- :
- All Forums
- :
- QlikView App Dev
- :
- Re: Rolling 12 with Year List Box
- Subscribe to RSS Feed
- Mark Topic as New
- Mark Topic as Read
- Float this Topic for Current User
- Bookmark
- Subscribe
- Mute
- Printer Friendly Page
- Mark as New
- Bookmark
- Subscribe
- Mute
- Subscribe to RSS Feed
- Permalink
- Report Inappropriate Content
Rolling 12 with Year List Box
I want to be able to create a line graph showing sum(Sales) for a specific Year which will be in my list box. Now for 2016 and prior since those years are complete it will always pick the 12 months of that year. For 2017 however currently it will only select 4 months Jan-Apr. I need Qlikview to be able to display the rolling 12 when i select 2017. However when i pick 2016 it will display 12 months of 2016 and so forth for 2015 and prior.
I did create 12 expressions to combat this however when you do it this way there are limitations when using the line graph(you will only see data point you will not see a line). See attached file.
Epxression I am currently using created:
=Sum({<YEAR=,DateofService = {"$(=Date(AddMonths(vCheck4,-11),'YYYYMM'))"}>}Sales)
=Sum({<YEAR=,DateofService = {"$(=Date(AddMonths(vCheck4,-10),'YYYYMM'))"}>}Sales)
=Sum({<YEAR=,DateofService = {"$(=Date(AddMonths(vCheck4,-9),'YYYYMM'))"}>}Sales)
=Sum({<YEAR=,DateofService = {"$(=Date(AddMonths(vCheck4,-8),'YYYYMM'))"}>}Sales)...and so forth.
- Mark as New
- Bookmark
- Subscribe
- Mute
- Subscribe to RSS Feed
- Permalink
- Report Inappropriate Content
Why not Sum({<YEAR=,DateofService = {"$(<=Date(AddMonths(vCheck4,-11),'YYYYMM'))"}>}Sales) ??
- Mark as New
- Bookmark
- Subscribe
- Mute
- Subscribe to RSS Feed
- Permalink
- Report Inappropriate Content
Well if you see the attached file from my previous post i cannot get a line graph using the existing expression. Unless in my expression i have Sum(Sales) and in my dimension i do something that takes care of the rolling date right?
- Mark as New
- Bookmark
- Subscribe
- Mute
- Subscribe to RSS Feed
- Permalink
- Report Inappropriate Content
You can use Date(vCheck4,'YYYYMM') as Dimension and Sum({<YEAR=,DateofService = {"<= $(=Date(AddMonths(vCheck4,-11),'YYYYMM'))"}>}Sales) as expression.
Am not completely sure which line graph you are referring to.
- Mark as New
- Bookmark
- Subscribe
- Mute
- Subscribe to RSS Feed
- Permalink
- Report Inappropriate Content
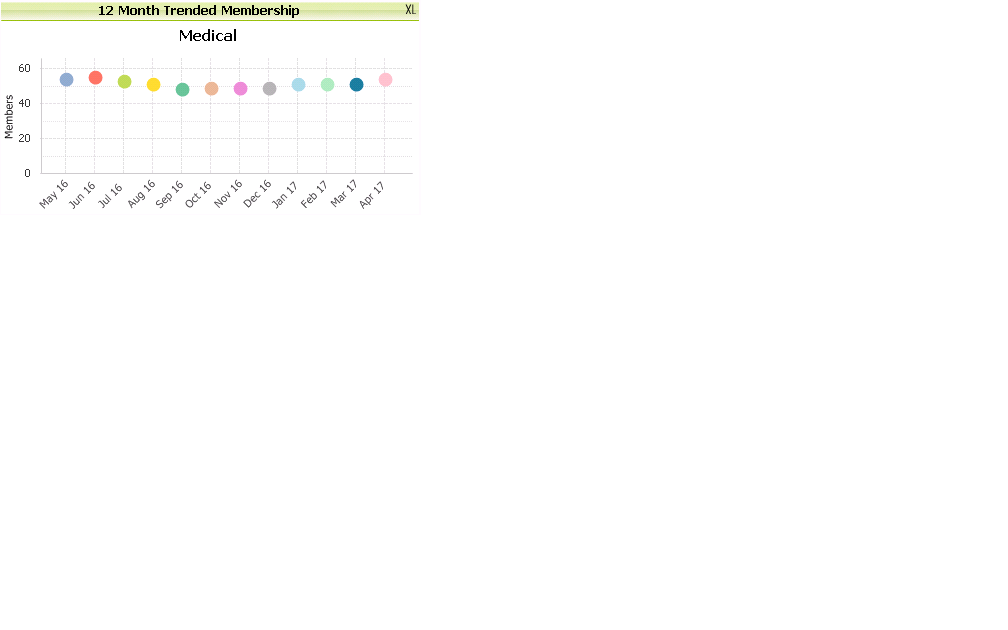
I have attached the graph i am getting right now which are Dots versus a line connecting each dot.
- Mark as New
- Bookmark
- Subscribe
- Mute
- Subscribe to RSS Feed
- Permalink
- Report Inappropriate Content
Can you try this as expression RangeSum(Above(Sum({<Month=, monthstart>} amount), 0, 12)) * Sum({<YEAR=,DateofService = {"<= $(=Date(AddMonths(vCheck4,-11),'YYYYMM'))"}>}1).
- Mark as New
- Bookmark
- Subscribe
- Mute
- Subscribe to RSS Feed
- Permalink
- Report Inappropriate Content
I am getting "No data to display". Dimension should be my MonthYear right?
What is the first part in the formula supposed to do? =RangeSum(Above(Sum({<MONTH=,DOS >} MM), 0, 12)) *
What to make sure i have the right fields.
- Mark as New
- Bookmark
- Subscribe
- Mute
- Subscribe to RSS Feed
- Permalink
- Report Inappropriate Content
It will calculate the rolling sum of last 12 months data for each month
- Mark as New
- Bookmark
- Subscribe
- Mute
- Subscribe to RSS Feed
- Permalink
- Report Inappropriate Content
Is there a way for the dimension to change where for 2017 it will be rolling but for other years it will the 12 months for the year selected and have the expression as Sum(Sales)?