Unlock a world of possibilities! Login now and discover the exclusive benefits awaiting you.
- Qlik Community
- :
- All Forums
- :
- QlikView App Dev
- :
- Rolling sum problem
- Subscribe to RSS Feed
- Mark Topic as New
- Mark Topic as Read
- Float this Topic for Current User
- Bookmark
- Subscribe
- Mute
- Printer Friendly Page
- Mark as New
- Bookmark
- Subscribe
- Mute
- Subscribe to RSS Feed
- Permalink
- Report Inappropriate Content
Rolling sum problem
Hi All,
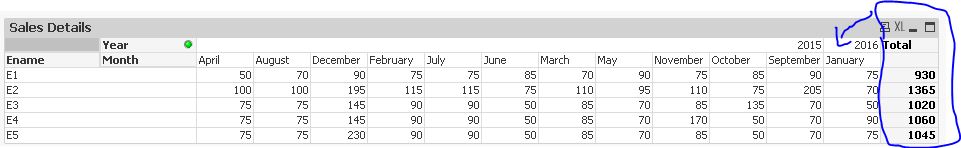
I want to show rolling 12 months data for each month in a row as shown below.
Used this formula:
Sum({<Year=, Quarter=, Month=, SalesDate={'>=$(=MonthStart(Max(SalesDate), -11))<=$(=Date(Max(SalesDate)))'}>} Sales )
It is showing data for rolling 12 months with for that month instead of summing up.
| For 2016 and January Month | ||
| Year | 2016 | |
| Ename | Month | January |
| E1 | 930 | |
| E2 | 1365 | |
| E3 | 1020 | |
| E4 | 1060 | |
| E5 | 1045 | |
| For 2015 and December Month | ||
| Year | 2015 | |
| Ename | Month | December |
| E1 | 940 | |
| E2 | 1370 | |
| E3 | 1020 | |
| E4 | 1020 | |
| E5 | 1020 | |
Accepted Solutions
- Mark as New
- Bookmark
- Subscribe
- Mute
- Subscribe to RSS Feed
- Permalink
- Report Inappropriate Content
Create an AsOf table in the script:
AsOf:
LOAD distinct
SalesDate as ReportDate,
Year(SalesDate) as ReportYear,
Month(SalesDate) as ReportMonth,
AddMonths(SalesDate,1-IterNo()) as SalesDate
RESIDENT
EmpSales
WHILE
IterNo() <= 12
;
Then replace your chart dimensions with ReportYear and ReportMonth.
See this blog post for more information: The As-Of Table
talk is cheap, supply exceeds demand
- Mark as New
- Bookmark
- Subscribe
- Mute
- Subscribe to RSS Feed
- Permalink
- Report Inappropriate Content
Hi,
Check this,
PFA,
Hirish
“Aspire to Inspire before we Expire!”
- Mark as New
- Bookmark
- Subscribe
- Mute
- Subscribe to RSS Feed
- Permalink
- Report Inappropriate Content
Hi Hirish,
I want to show like this:
For January 2016, need to show Total value at the January Column.
- Mark as New
- Bookmark
- Subscribe
- Mute
- Subscribe to RSS Feed
- Permalink
- Report Inappropriate Content
Hi,
check this you need totals for whole year or what!
PFA
“Aspire to Inspire before we Expire!”
- Mark as New
- Bookmark
- Subscribe
- Mute
- Subscribe to RSS Feed
- Permalink
- Report Inappropriate Content
- Mark as New
- Bookmark
- Subscribe
- Mute
- Subscribe to RSS Feed
- Permalink
- Report Inappropriate Content
Create an AsOf table in the script:
AsOf:
LOAD distinct
SalesDate as ReportDate,
Year(SalesDate) as ReportYear,
Month(SalesDate) as ReportMonth,
AddMonths(SalesDate,1-IterNo()) as SalesDate
RESIDENT
EmpSales
WHILE
IterNo() <= 12
;
Then replace your chart dimensions with ReportYear and ReportMonth.
See this blog post for more information: The As-Of Table
talk is cheap, supply exceeds demand
- Mark as New
- Bookmark
- Subscribe
- Mute
- Subscribe to RSS Feed
- Permalink
- Report Inappropriate Content
Hi gwassenaar
Perfect. Thanks a lot.
- Mark as New
- Bookmark
- Subscribe
- Mute
- Subscribe to RSS Feed
- Permalink
- Report Inappropriate Content
Hi,
PFA
Hope this helps!!