Unlock a world of possibilities! Login now and discover the exclusive benefits awaiting you.
- Qlik Community
- :
- All Forums
- :
- QlikView App Dev
- :
- Running total by Month/Day for ItemNumber, Color, ...
- Subscribe to RSS Feed
- Mark Topic as New
- Mark Topic as Read
- Float this Topic for Current User
- Bookmark
- Subscribe
- Mute
- Printer Friendly Page
- Mark as New
- Bookmark
- Subscribe
- Mute
- Subscribe to RSS Feed
- Permalink
- Report Inappropriate Content
Running total by Month/Day for ItemNumber, Color, Size
Hi i need help in setting up a running total for month and Day and have the ability to drill down from Item Number to Color to SIze.
Can anybody point me in the right direction? Ideas? not sure where to start
- Tags:
- running totals
Accepted Solutions
- Mark as New
- Bookmark
- Subscribe
- Mute
- Subscribe to RSS Feed
- Permalink
- Report Inappropriate Content
Hi Nestor!
Sorry, I think that now I'm going to owe you! I'm an initiate too. What I can do now is try to explain the solution: as you can see in the script, I implemented the concept of AsOf table for Month and for Days (as you initialy asked for). This concept creates an extra dimension of dates FROM the Period dimension. If you want to use these AsOf dimension in your chart/table, for each day between the transaction days you will have the value repeated. If you can observe, this happens to the asof_month too. And this happens because the two AsOf tables are linked to the Period table and not to the Transaction table (type CTRL+T to see the table diagram).
Well, I think that you can close this thread as answered  or set as Helpfull or just click "Like" if you think so. If you mark as answered, you can open another, asking someone to help you in this new situation that you are now. Of sure a "top" member will help you!
My best regards,
Marcello
- Mark as New
- Bookmark
- Subscribe
- Mute
- Subscribe to RSS Feed
- Permalink
- Report Inappropriate Content
Hi Nestor Ramirez!
I don't know if I understood your needs. If not, please excuse me!
In QlikView, if you need drill, you have to use Groups! When setting Dimensions, you have to create a group of dimensions and then you have to use the group in place of the dimension. Please see the QV manual to learn how to do this.
Attached your QVW updated with a group I created with ItemID -> Color -> Size in the Pivot Table called "QTY WIthout Running Totals with Group" in the "Copy of Transaction History" tab. To drill down you heve just to click on ItemID, then on a ColorID and then on a SizeID. To drill up use the arrow on dimension header.
Best regards,
Marcello
- Mark as New
- Bookmark
- Subscribe
- Mute
- Subscribe to RSS Feed
- Permalink
- Report Inappropriate Content
- Mark as New
- Bookmark
- Subscribe
- Mute
- Subscribe to RSS Feed
- Permalink
- Report Inappropriate Content
Hi Marcello,
thanks for the feedback.
My current need is to create a running total by month which I have up and running, but i also need to create a running total by day. I'm unsure how to add it to my script so i can have my month running total and Day running total. I'm using the As of table for the month, but that's were i got stuck and not sure how to apply the day using the as of.
- Mark as New
- Bookmark
- Subscribe
- Mute
- Subscribe to RSS Feed
- Permalink
- Report Inappropriate Content
Hi Nestor!
If I understood, I don't think you need an AsOf table. Please have a look at the script of the attached application. Now you have a Period Dimension generated only with the dates from the Transaction table (ATTENTION: as I didn't have your Transaction QVD, I saved an Excel file to be my data source, so if you will consider my script, please change back this part of your script).
Well, now with the date of the transactions in diferent format, you can agregate them in diferent ways. Please have a look at the pivot table chart in the second tab of the aplication: with groups now you can have running totals by month (MMMYYYY format) and by day (MM/DD/YYYY) or in any other format.
With an hierarchy group I also created the dimension of items aggregating by Location, then by color, then by sise then by item ID.
Is it what you need? Sorry my english, it's worse than I thought!
Best regards,
Marcello
- Mark as New
- Bookmark
- Subscribe
- Mute
- Subscribe to RSS Feed
- Permalink
- Report Inappropriate Content
Hi Marcelo,
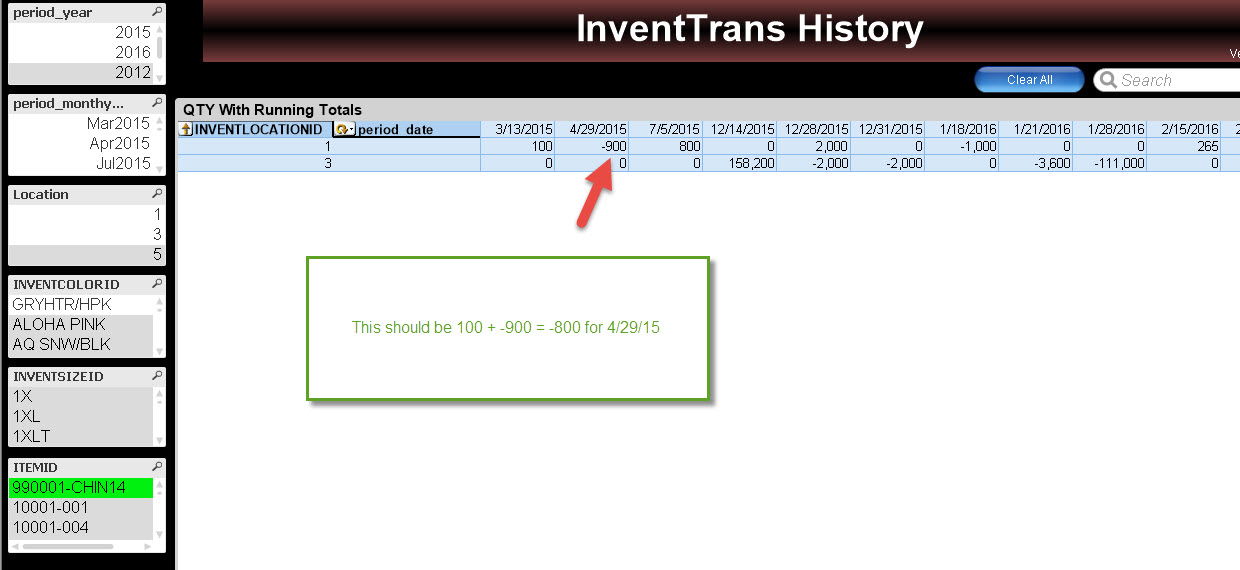
the only thing missing from your solution is that i need the qty's to show the running total. for example in the solution you attached and if you do a filter for 990001-CHIN14 for my month the running total is -800 (100 + -900 = -800) where in your solution you have -900 which is what the transaction shows for 4/29/2015. I need the qty to be a running total by month or day.
so if the running total by day was working i would expect to see 4/29/2016 of -800.
hope that makes sense.
- Mark as New
- Bookmark
- Subscribe
- Mute
- Subscribe to RSS Feed
- Permalink
- Report Inappropriate Content
Hi Nestor!
Have a look at the attached and please say me if now its what you need.
Thanks,
Marcello
- Mark as New
- Bookmark
- Subscribe
- Mute
- Subscribe to RSS Feed
- Permalink
- Report Inappropriate Content
Hi Marcello,
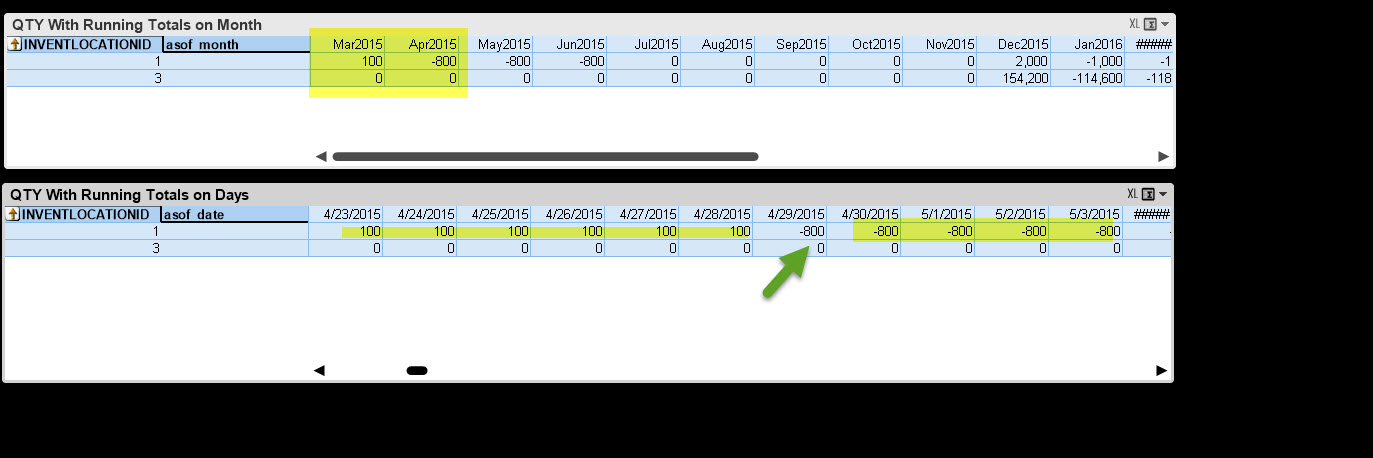
Wow, thank you for the help with this. It is giving me the correct information, would there be a way to not show the qty daily but only when there's a transaction. for example my starting qty in March is 100 and the next transaction occur in april 29th, however i'm seeing 100 for all days leading to april 29. would there be a way to only see the 100 for March 13 and then have Zero or blank until April 29th when it creates a -800 because of the running total.
Let me know if this makes sense..
its amazing how much i still don't know about Qlik.. Thanks for all this Marcello. I really appreciated.
- Mark as New
- Bookmark
- Subscribe
- Mute
- Subscribe to RSS Feed
- Permalink
- Report Inappropriate Content
Hi Nestor!
Sorry, I think that now I'm going to owe you! I'm an initiate too. What I can do now is try to explain the solution: as you can see in the script, I implemented the concept of AsOf table for Month and for Days (as you initialy asked for). This concept creates an extra dimension of dates FROM the Period dimension. If you want to use these AsOf dimension in your chart/table, for each day between the transaction days you will have the value repeated. If you can observe, this happens to the asof_month too. And this happens because the two AsOf tables are linked to the Period table and not to the Transaction table (type CTRL+T to see the table diagram).
Well, I think that you can close this thread as answered or set as Helpfull or just click "Like" if you think so. If you mark as answered, you can open another, asking someone to help you in this new situation that you are now. Of sure a "top" member will help you!
My best regards,
Marcello