Unlock a world of possibilities! Login now and discover the exclusive benefits awaiting you.
- Qlik Community
- :
- All Forums
- :
- QlikView App Dev
- :
- Re: SPC / Run Chart
- Subscribe to RSS Feed
- Mark Topic as New
- Mark Topic as Read
- Float this Topic for Current User
- Bookmark
- Subscribe
- Mute
- Printer Friendly Page
- Mark as New
- Bookmark
- Subscribe
- Mute
- Subscribe to RSS Feed
- Permalink
- Report Inappropriate Content
SPC / Run Chart
Hi,
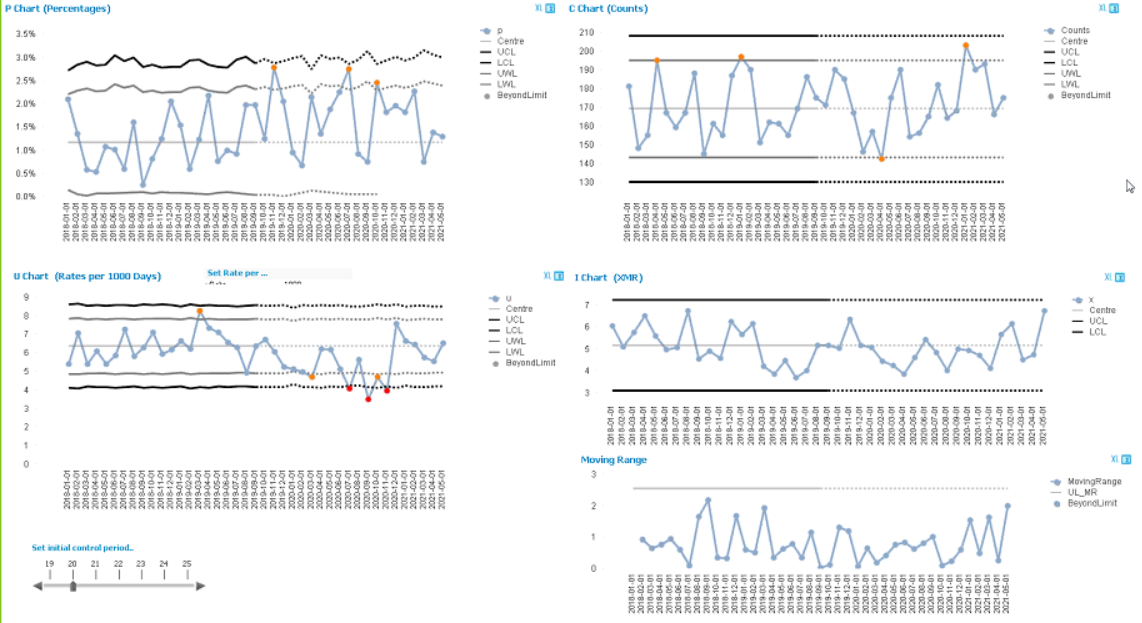
I have managed to create an SPC/Run Chart that highlights data points that fall above or below the Upper or Lower contol lines. What I am trying to work out is how to highlight a run of 7 points either above or below the controls?
Is this possible?
Thanks,
Tim
- Mark as New
- Bookmark
- Subscribe
- Mute
- Subscribe to RSS Feed
- Permalink
- Report Inappropriate Content
Hi,
maybe altering the expressions suggested in this thread Control startto test for UCL/LCL violations?
hope this helps
regards
Marco
- Mark as New
- Bookmark
- Subscribe
- Mute
- Subscribe to RSS Feed
- Permalink
- Report Inappropriate Content
Hi tjm20111102,
We have an on-demand session with the NHS and how they build and leverage Statistical Process Control Charts (SPC) and Run Charts in QlikView and Qlik Sense. johnmackintosh covers these topics in depth:
- Variation and importance in Quality Improvement (QI) projects within healthcare
- The Run Chart
- Run Chart Rules
- Simple QlikView run chart
- (Statistical) Process Control (SPC)
- ‘I’ ‘P’ ‘C’ ‘U’ - Examples
- Rare events / time between
Be sure to check this out: http://bit.ly/2Cc1GlK
- Mark as New
- Bookmark
- Subscribe
- Mute
- Subscribe to RSS Feed
- Permalink
- Report Inappropriate Content
Hi Joe
how do you calculate you SD for P Chart?
- Mark as New
- Bookmark
- Subscribe
- Mute
- Subscribe to RSS Feed
- Permalink
- Report Inappropriate Content
We have also released a Control Chart extension for Qlik Sense. More information and a 60 day trial can be downloaded from here.
Key features include: • Outliers Highlighted • Runs ‘above’ and ‘below’ the average highlighted • Trends up and down highlighted • Moving average based on Runs and/ or Trend triggers
Key configuration options include: • Customise Labels for Dimensions, Measures and Rules • Customise Line and point style for Dimensions, Measures and Rules • Pick the number of points to set the highlighting criteria for both Runs and Trends
For more information email: extensions@acumenbi.co.nz .
- Mark as New
- Bookmark
- Subscribe
- Mute
- Subscribe to RSS Feed
- Permalink
- Report Inappropriate Content
Hi Joe
I'm really interested in being to accomplish this and would like to see the presentation to which you refer. Is there an up-to-date link / source for this please? (As of Dec 2020, link in the post leads to 'Unavailable').
- Mark as New
- Bookmark
- Subscribe
- Mute
- Subscribe to RSS Feed
- Permalink
- Report Inappropriate Content
HI Graham, Information on Acumens Control Chart extension for Qlik can be found here: https://acumenbi.co.nz/qlik/acumen-control-charts/ We have many customers using this in production. If you can email me at extensions@acumenbi.co.nz i can provide you a demonstration and a trial version for 30 days. Kind regards, Dan