Unlock a world of possibilities! Login now and discover the exclusive benefits awaiting you.
- Qlik Community
- :
- All Forums
- :
- QlikView App Dev
- :
- Scatter Chart - Hide some bubbles
- Subscribe to RSS Feed
- Mark Topic as New
- Mark Topic as Read
- Float this Topic for Current User
- Bookmark
- Subscribe
- Mute
- Printer Friendly Page
- Mark as New
- Bookmark
- Subscribe
- Mute
- Subscribe to RSS Feed
- Permalink
- Report Inappropriate Content
Scatter Chart - Hide some bubbles
Hi Community!
Maybe someone faced that problem before.
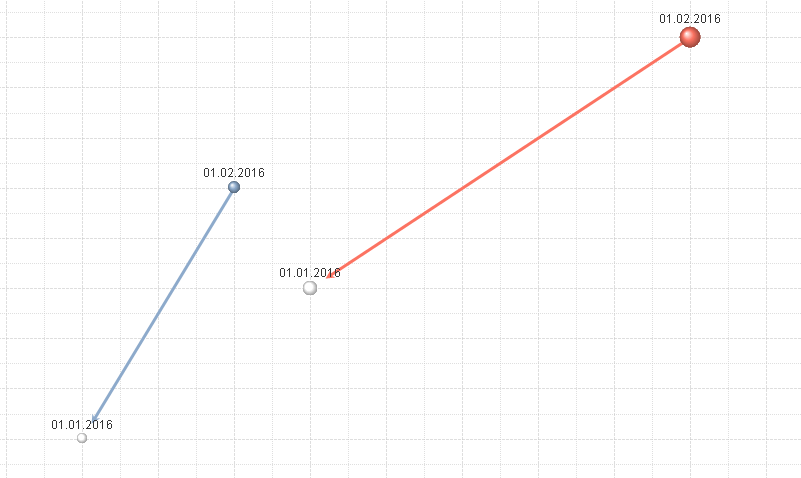
I've got scatter chart with few dimensions, arrows directions shows conditions of the bubbles for the previous period.

Question: Is that possible to hide the bubbles of the previous period and how to do that?
P.S.: Demo in attachment.
Thanks in advance.
Accepted Solutions
- Mark as New
- Bookmark
- Subscribe
- Mute
- Subscribe to RSS Feed
- Permalink
- Report Inappropriate Content
You could mess around with the bubble and text colours using something like =if(Period='01.01.2016',argb(255,255,255,255))
Not sure though, might just take some playing with
- Mark as New
- Bookmark
- Subscribe
- Mute
- Subscribe to RSS Feed
- Permalink
- Report Inappropriate Content
You could mess around with the bubble and text colours using something like =if(Period='01.01.2016',argb(255,255,255,255))
Not sure though, might just take some playing with
- Mark as New
- Bookmark
- Subscribe
- Mute
- Subscribe to RSS Feed
- Permalink
- Report Inappropriate Content
Thanks. It's the righl logic. But the legend is going gray.
Maybe any ideas how to solve that problem?
- Mark as New
- Bookmark
- Subscribe
- Mute
- Subscribe to RSS Feed
- Permalink
- Report Inappropriate Content
Use the ColorMix functions.