Unlock a world of possibilities! Login now and discover the exclusive benefits awaiting you.
- Qlik Community
- :
- All Forums
- :
- QlikView App Dev
- :
- Scatterplot Sorting
- Subscribe to RSS Feed
- Mark Topic as New
- Mark Topic as Read
- Float this Topic for Current User
- Bookmark
- Subscribe
- Mute
- Printer Friendly Page
- Mark as New
- Bookmark
- Subscribe
- Mute
- Subscribe to RSS Feed
- Permalink
- Report Inappropriate Content
Scatterplot Sorting
Hi,
I have a scatterplot, that shows all values ( {1} ) and I Highlight the selection using Color and opacity.
However, I have yet to find a sorting order sat places the possible values before the background.
How can I achieve that.
Best Regards
- Mark as New
- Bookmark
- Subscribe
- Mute
- Subscribe to RSS Feed
- Permalink
- Report Inappropriate Content
can you show how the result should look like?
- Mark as New
- Bookmark
- Subscribe
- Mute
- Subscribe to RSS Feed
- Permalink
- Report Inappropriate Content
Hi Christoph,
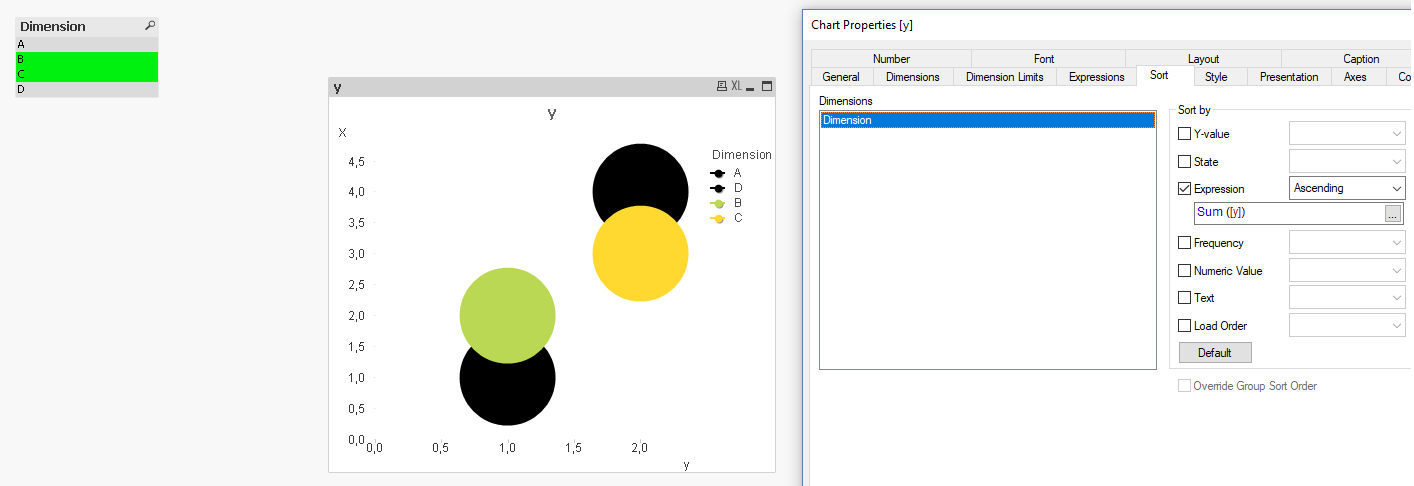
You can use the "Sort by Expression" option and enter your expression without the {1} set.
Please find my attached example.
Hope this helps you.
With kind regards,
Ronald
- Mark as New
- Bookmark
- Subscribe
- Mute
- Subscribe to RSS Feed
- Permalink
- Report Inappropriate Content
I am Well aware of that. But it is just that Expression i require.
All samples are always visible and only the possible are colored. The others are black. The transparency of colour and black samples can be adjusted.
But since I have thousands of samples it's highly possible that the black samples overlap the coloured samples especially if I want to display a single coloured sample.
vB API allows me to get only possible values the chart functions do not appear to provide the same functionality.
Best regards
- Mark as New
- Bookmark
- Subscribe
- Mute
- Subscribe to RSS Feed
- Permalink
- Report Inappropriate Content
Hi Christoph,
I'm pretty sure that using "Sort by Expression" with an expression containing just the "possible/colored" samples will sort them "on top" of the black samples, as in my demo.
That would meet your requirement, right?
With kind regards,
Ronald
- Mark as New
- Bookmark
- Subscribe
- Mute
- Subscribe to RSS Feed
- Permalink
- Report Inappropriate Content
I'm on my phone right now but I will check once I'm on my laptop. Thank you very much