Unlock a world of possibilities! Login now and discover the exclusive benefits awaiting you.
- Qlik Community
- :
- All Forums
- :
- QlikView App Dev
- :
- Second dimension in bar chart
Options
- Subscribe to RSS Feed
- Mark Topic as New
- Mark Topic as Read
- Float this Topic for Current User
- Bookmark
- Subscribe
- Mute
- Printer Friendly Page
Turn on suggestions
Auto-suggest helps you quickly narrow down your search results by suggesting possible matches as you type.
Showing results for
Anonymous
Not applicable
2014-12-19
11:19 AM
- Mark as New
- Bookmark
- Subscribe
- Mute
- Subscribe to RSS Feed
- Permalink
- Report Inappropriate Content
Second dimension in bar chart
Hi guys I cannot add a second dimension in a bar chart showing the values in the axis, I remember it was possible before, isntead it looks like in the image
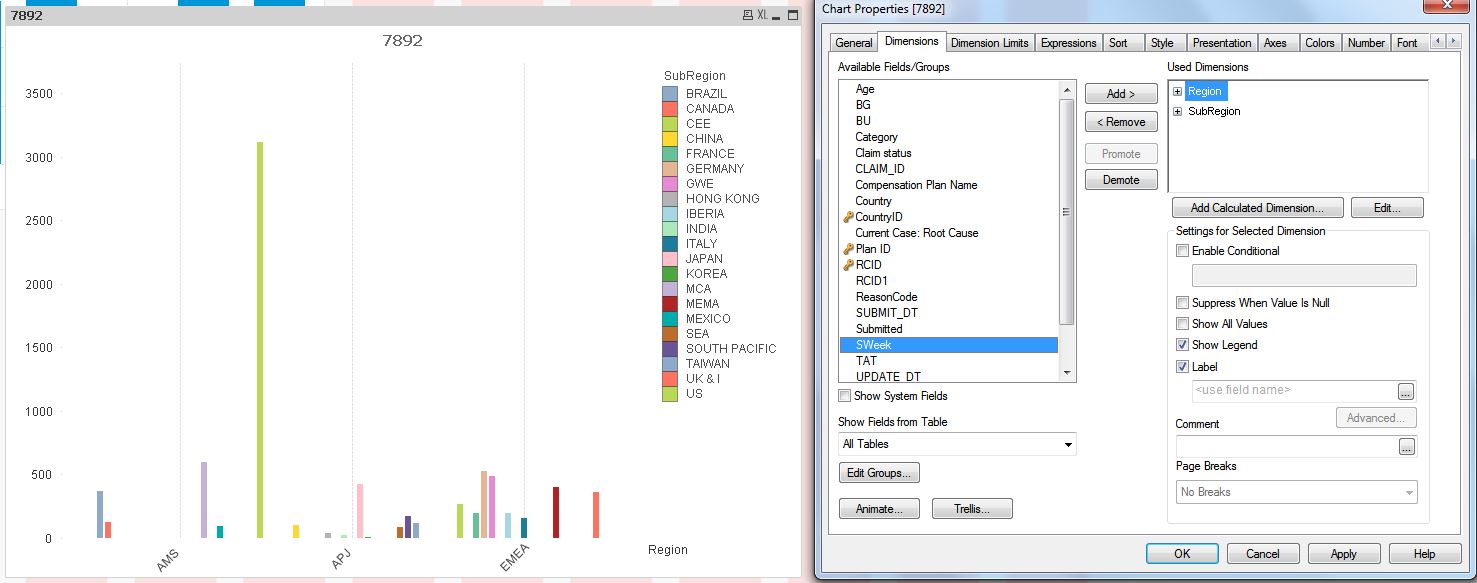
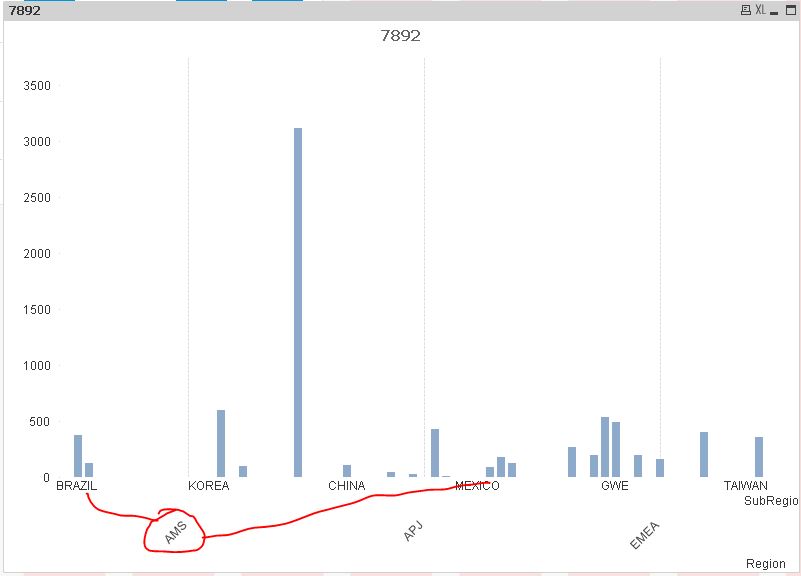
now, I found that adding a dummy second expression "0" and hiding the legend will force it to show in the axis, but they are all mixed randomly the buckets are incorrect (see image below), is there a way to fix this? Thanks in advance!
375 Views
2 Replies
Not applicable
2014-12-19
11:26 AM
Author
- Mark as New
- Bookmark
- Subscribe
- Mute
- Subscribe to RSS Feed
- Permalink
- Report Inappropriate Content
Hey, Could you please attach your data?
212 Views
Anonymous
Not applicable
2014-12-19
11:33 AM
Author
- Mark as New
- Bookmark
- Subscribe
- Mute
- Subscribe to RSS Feed
- Permalink
- Report Inappropriate Content
Here's the example QVW
212 Views