Unlock a world of possibilities! Login now and discover the exclusive benefits awaiting you.
- Qlik Community
- :
- All Forums
- :
- QlikView App Dev
- :
- Seek helps for auto create new chart when fulfill ...
- Subscribe to RSS Feed
- Mark Topic as New
- Mark Topic as Read
- Float this Topic for Current User
- Bookmark
- Subscribe
- Mute
- Printer Friendly Page
- Mark as New
- Bookmark
- Subscribe
- Mute
- Subscribe to RSS Feed
- Permalink
- Report Inappropriate Content
Seek helps for auto create new chart when fulfill the filtering criteria in excel
Dear Friends,
I have a very complicated requirement that I need to use Macros to create new chart if the data fulfill the filtering criteria in excel. I downloaded many qvw files including APIguide.qvw in the forum for studying macro but I'm still confuse about how to use APIguide to write macro for it...
Hope someone can lend me a hand and appreciate I can get some suggestion about how to write macro codes using APIguide, thanks a lot!
Here's the detail.
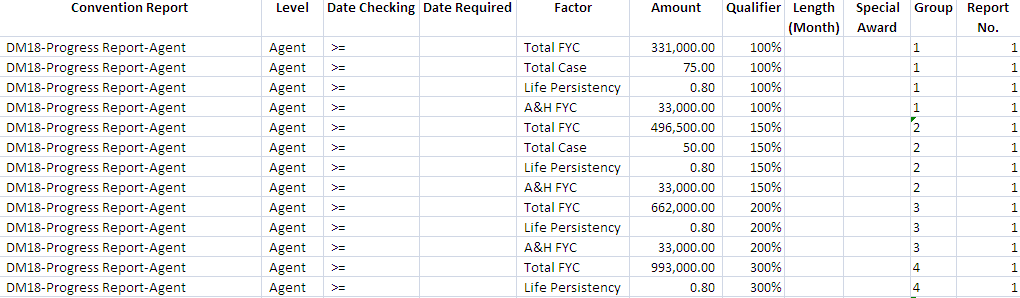
"QV-ContestNConventions_Test.xlsx" includes the selection criteria for creating chart
"Test_Data.xlsx" I input some tesing data.
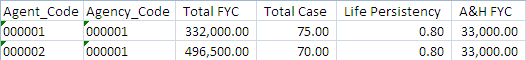
Because Agent_Code "000001" fulfill the filtering criteria of Group1, Report No.1. (Total FYC>=331000 and Total Case>=75 and Life Persistency>=0.8 and A&H FYC>=33000), so I need to create a chart or table box for example as below(Qualifier depends on "QV-ContestNConventions_Test.xlsx")

Same story, Agent_Code "000002" fulfill the filtering criteria of Group2, Report No.1.(Total FYC>=496500 and Total Case>=50 and Life Persistency>=0.8 and A&H FYC>=33000), so another chart or table box is created.

In a word, how many objects I created depends on how much data fulfill the "Group" requirement in "QV-ContestNConventions_Test.xlsx". I think macro should be the only way I can achieve such complicated requirement. I need to write macro in button to dynamic create new charts. Hope someone can help! Thanks.