Unlock a world of possibilities! Login now and discover the exclusive benefits awaiting you.
- Qlik Community
- :
- All Forums
- :
- QlikView App Dev
- :
- Select only one part of a dimension in a table
- Subscribe to RSS Feed
- Mark Topic as New
- Mark Topic as Read
- Float this Topic for Current User
- Bookmark
- Subscribe
- Mute
- Printer Friendly Page
- Mark as New
- Bookmark
- Subscribe
- Mute
- Subscribe to RSS Feed
- Permalink
- Report Inappropriate Content
Select only one part of a dimension in a table
Hello,
I have a fact table with the following dimensions:
- Invoice
- Product
- Year
- Value
I would like to have a table that shows:
| Product | 2015 Sales | 2014 Sales |
|---|---|---|
I can do it just fine with set analysis, of course:
=Sum ({$<Year={'2015'))},[Value]).
=Sum ({$<Year={'2014'))},[Value])
The thing is that I would like to show only products with 2015 sales in my "Product" column, and keep the 2014 sales column. I'm not sure how I can do this.
Accepted Solutions
- Mark as New
- Bookmark
- Subscribe
- Mute
- Subscribe to RSS Feed
- Permalink
- Report Inappropriate Content
The easiest way is to condition the second expression on the value of the first expression, like this:
=
IF([2015 Sales] <> 0,
Sum ({$<Year={'2014'))},[Value])
)
cheers,
Oleg Troyansky
QlikView Your Business: An expert guide to Business Discovery with QlikView and Qlik Sense
- Mark as New
- Bookmark
- Subscribe
- Mute
- Subscribe to RSS Feed
- Permalink
- Report Inappropriate Content
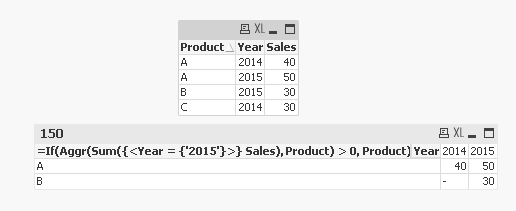
Try Using:
Aggr(Only({$<Year={'2015'}>}Product),Product)
Edit: If that expression isnt working, post a demo document or some sample data/
- Mark as New
- Bookmark
- Subscribe
- Mute
- Subscribe to RSS Feed
- Permalink
- Report Inappropriate Content
The easiest way is to condition the second expression on the value of the first expression, like this:
=
IF([2015 Sales] <> 0,
Sum ({$<Year={'2014'))},[Value])
)
cheers,
Oleg Troyansky
QlikView Your Business: An expert guide to Business Discovery with QlikView and Qlik Sense
- Mark as New
- Bookmark
- Subscribe
- Mute
- Subscribe to RSS Feed
- Permalink
- Report Inappropriate Content
May be something like this:
- Mark as New
- Bookmark
- Subscribe
- Mute
- Subscribe to RSS Feed
- Permalink
- Report Inappropriate Content
Hi
Do u want to show 2014 and 2015 sales in a straight table is that correct
then you need to nullify the year in the set analysis
if its so mean
CY
sum({$<year={"$(=Max(Year))"}>}Sales)
LY
sum({$<year={"$(=Year(Max(Year)))-1"},Year=,Month=>}Sales)
or
sum({$<year={"$(=Max(Year)-1)"},Year=,Month=>}Sales)
- Mark as New
- Bookmark
- Subscribe
- Mute
- Subscribe to RSS Feed
- Permalink
- Report Inappropriate Content
Yes, thanks! That's simple. I also ticked the option to not show null values.