Unlock a world of possibilities! Login now and discover the exclusive benefits awaiting you.
- Qlik Community
- :
- All Forums
- :
- QlikView App Dev
- :
- Selecting previous year summations, using set anal...
- Subscribe to RSS Feed
- Mark Topic as New
- Mark Topic as Read
- Float this Topic for Current User
- Bookmark
- Subscribe
- Mute
- Printer Friendly Page
- Mark as New
- Bookmark
- Subscribe
- Mute
- Subscribe to RSS Feed
- Permalink
- Report Inappropriate Content
Selecting previous year summations, using set analysis?
Hello,
I need to create a chart comparing summations (total amt, gift count, ID count) for a year, and a previous year. I also need the year to be selectable...back 10 years. For instance, a user selects 2011, and a chart shows 2011 summations and 2010 summations; if 2008 is selected, then 2008 and 2007. So, I've tried to create a table chart... with the following
FiscalYear: Total Amount, Gift Count, Distinct ID Count
Prior FiscalYear: Total Amount, Gift Count, Distinst ID Count...
I also have a filter flag for Cash: [Cash Flag]
1. Here are my first three columns:
Total Amount = num(sum({1<[Cash Flag] = {1} >} [Amount]), '$#,##0.00;($#,##0.00)')
Gift Count = num(count({1<[Cash Flag] = {1} >}[Gift Number]), '#,##0')
Distinct ID Count = num(count(DISTINCT {1<[Cash Flag] = {1} >} [ID Number]), '#,##0')
2. Prior year??? I can't get the set-analysis to pull the totals for a previous year...
For instance, in trying to find the previous year Total Amount, none of these work:
= num(sum({1<[Gift FY] = {$(=[Gift FY]-1)}, [Cash Flag] = {1} >} [Amount]), '$#,##0.00;($#,##0.00)')
= num(sum({1<[Gift FY] = {$([Gift FY]-1)}, [Cash Flag] = {1} >} [Amount]), '$#,##0.00;($#,##0.00)')
= num(sum({1<[Gift FY] = {"$(=[Gift FY]-1)"}, [Cash Flag] = {1} >} [Amount]), '$#,##0.00;($#,##0.00)')
= num(sum({1<[Gift FY] = {"$([Gift FY]-1)"}, [Cash Flag] = {1} >} [Amount]), '$#,##0.00;($#,##0.00)')
How do I select previous year summations, using set analysis?
- Mark as New
- Bookmark
- Subscribe
- Mute
- Subscribe to RSS Feed
- Permalink
- Report Inappropriate Content
hi
you can try this
num(sum({1<[Gift FY] = {$(=max([Gift FY])-1)}, [Cash Flag] = {1} >} [Amount]), '$#,##0.00;($#,##0.00)')
- Mark as New
- Bookmark
- Subscribe
- Mute
- Subscribe to RSS Feed
- Permalink
- Report Inappropriate Content
You will get basic information from below thread...
- Mark as New
- Bookmark
- Subscribe
- Mute
- Subscribe to RSS Feed
- Permalink
- Report Inappropriate Content
Liron,
Hello, your answer is useful, and I address the need I stated above. However, let me explain more specifically
I'm trying to calulate differences from year to year, over a ten year period, comparing a) a current year's numbers, and b) the differences from a prior year. The curent year's numbers and differencs need to show up on the same row.
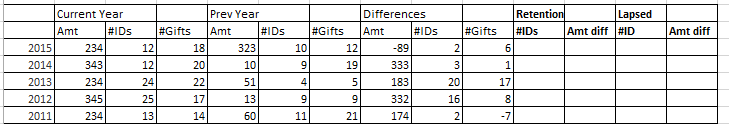
I need to show this years data (Amt, #IDs, #Gifts), Last year's data (Amt, #IDs, #Gifts), the differences, and most importantly:
a) the number of IDs that have carried over to the current year (that is, "retained"... they were in both years), plus amount differences for these retained ID only; and b) the number of IDs that were left behind ('lapsed' from the previous year), plus the amount differences for these lapsed ID only [how much they gave in the previous year]
I thought I could use set-analysis...but haven't yet found a good example...
jarrell