Unlock a world of possibilities! Login now and discover the exclusive benefits awaiting you.
- Qlik Community
- :
- All Forums
- :
- QlikView App Dev
- :
- Re: Set Analysis Expression to apply last month
- Subscribe to RSS Feed
- Mark Topic as New
- Mark Topic as Read
- Float this Topic for Current User
- Bookmark
- Subscribe
- Mute
- Printer Friendly Page
- Mark as New
- Bookmark
- Subscribe
- Mute
- Subscribe to RSS Feed
- Permalink
- Report Inappropriate Content
Set Analysis Expression to apply last month
Hi,
I have data like below.
| Appid | Loaddate | Status |
| 2 | Jan-13 | Active |
| 3 | Jan-13 | Deleted |
| 1 | Feb-13 | Deleted |
| 2 | Feb-13 | Active |
| 3 | Feb-13 | Active |
| 1 | Mar-13 | Active |
| 2 | Mar-13 | Deleted |
| 3 | Mar-13 | Active |
Now I want to create a bar chart like below
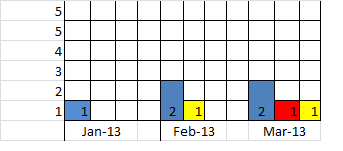
blue color bar means: total distict appid that are having status Active
Red Color Bar means: total distinct appid those are having status Active in previous month but Deleted in current month
ex: appid =2, it is active in feb but deleted in mar
Yello Color bar means: total distinct appid those are having status Deletedin previous month but Activein current month
ex: appid = 3
I tried this expression:
count
({<Status = {"Active"},Appid = P({<Loaddate={"$(=date(above(only(Loaddate),1),'DD-MMM-YYYY'))"},Status = {"Deleted"}>} Appid)>}DISTINCT Appid)
But this is not working and
=
date(above(only(Loaddate),1),'DD-MMM-YYYY')
it is giving the previous month.
Please anybody helps me how to acheive the above described.
Thanks in advance,
Niranjan M.
Accepted Solutions
- Mark as New
- Bookmark
- Subscribe
- Mute
- Subscribe to RSS Feed
- Permalink
- Report Inappropriate Content
Hi All,
Thanks Gysbert Wassenaar 
I go tthe solution for the above,sloved it by combination of both script and set analysis.
Data:
Load
Appid,Loaddate,Status, Appid & Month(Loaddate) & Year (Loaddate) as Key
from ....<file>;
Counts:
Load
Key,
Lookup('Status','Key',Appid & Month(AddMonths(Loaddate,-1)) & Year(AddMonths(Loaddate,-1))) As LastMonth_App_Status,
Resident
Data;
Use the below expression for the bar chart:
blue: count ({<Status={"Active"}>} Appid)
Red: Count({<LastMonth_App_Status={"Active"},Status={"Deleted"}>} Appid)
Yellow: Count({<LastMonth_App_Status={"Deleted"},Status={"Active"}>} Appid)
Thanks to all
Niranjan M.
- Mark as New
- Bookmark
- Subscribe
- Mute
- Subscribe to RSS Feed
- Permalink
- Report Inappropriate Content
See attached qvw
talk is cheap, supply exceeds demand
- Mark as New
- Bookmark
- Subscribe
- Mute
- Subscribe to RSS Feed
- Permalink
- Report Inappropriate Content
Hi All,
Thanks Gysbert Wassenaar
I go tthe solution for the above,sloved it by combination of both script and set analysis.
Data:
Load
Appid,Loaddate,Status, Appid & Month(Loaddate) & Year (Loaddate) as Key
from ....<file>;
Counts:
Load
Key,
Lookup('Status','Key',Appid & Month(AddMonths(Loaddate,-1)) & Year(AddMonths(Loaddate,-1))) As LastMonth_App_Status,
Resident
Data;
Use the below expression for the bar chart:
blue: count ({<Status={"Active"}>} Appid)
Red: Count({<LastMonth_App_Status={"Active"},Status={"Deleted"}>} Appid)
Yellow: Count({<LastMonth_App_Status={"Deleted"},Status={"Active"}>} Appid)
Thanks to all
Niranjan M.