Unlock a world of possibilities! Login now and discover the exclusive benefits awaiting you.
- Qlik Community
- :
- All Forums
- :
- QlikView App Dev
- :
- Re: Set Analysis Expression
- Subscribe to RSS Feed
- Mark Topic as New
- Mark Topic as Read
- Float this Topic for Current User
- Bookmark
- Subscribe
- Mute
- Printer Friendly Page
- Mark as New
- Bookmark
- Subscribe
- Mute
- Subscribe to RSS Feed
- Permalink
- Report Inappropriate Content
Set Analysis Expression
Dear Experts,
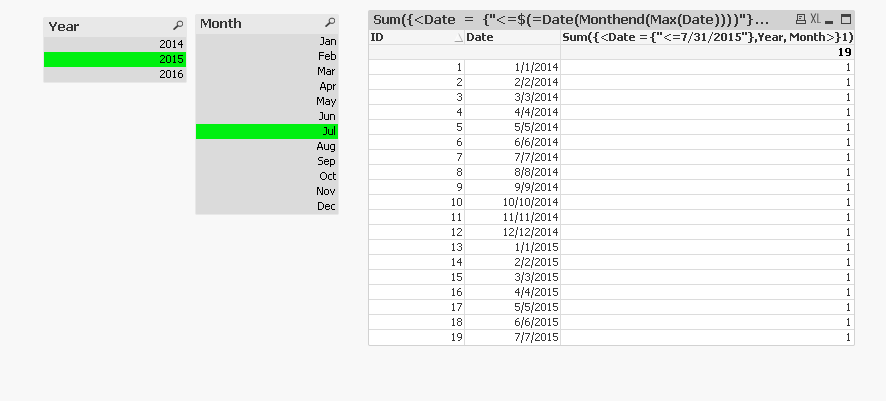
I am trying to achieve a functionality where if year is selected then all records having year <= that year should be displayed in straight table and count of distinct IDs displayed in text box.
Also if some year is selected and a particular month is selected let say year selected as 2015 and Month selected as April then all records should be displayed till April 2015 (including all records from all months in Year 2014).
Attached is dummy qvw file with dummy data.
Any help in this regard is highly appreciated.
Regards,
RG
Accepted Solutions
- Mark as New
- Bookmark
- Subscribe
- Mute
- Subscribe to RSS Feed
- Permalink
- Report Inappropriate Content
- Mark as New
- Bookmark
- Subscribe
- Mute
- Subscribe to RSS Feed
- Permalink
- Report Inappropriate Content
Try this:
=Count({<Date = {"$(='<=' & Date(Max(Date)))"}, Year, Month>}ID)
Where Year and Month are created in the script and not on the front end
- Mark as New
- Bookmark
- Subscribe
- Mute
- Subscribe to RSS Feed
- Permalink
- Report Inappropriate Content
Maybe like attached (created Year and Month fields in the script):
- Mark as New
- Bookmark
- Subscribe
- Mute
- Subscribe to RSS Feed
- Permalink
- Report Inappropriate Content
See also this series of blog posts for an better understanding of analyzing time periods / point in time reporting:
The Magic of Set Analysis - Point In Time Reporting • Blog • AfterSync
P.S. and you don't need the Monthend() function, that's a relict from a different earlier approach.
- Mark as New
- Bookmark
- Subscribe
- Mute
- Subscribe to RSS Feed
- Permalink
- Report Inappropriate Content
Thank you Swuehl.
Solution works perfect and thanks for sharing the blog as it really helped.
Regards,
RG
- Mark as New
- Bookmark
- Subscribe
- Mute
- Subscribe to RSS Feed
- Permalink
- Report Inappropriate Content
Hi Sunny,
Thanks for taking time to reply on my question.
The solution works perfect.
As I can mark only one answer as correct answer I was not able to mark yours as well.
Regards,
RG
- Mark as New
- Bookmark
- Subscribe
- Mute
- Subscribe to RSS Feed
- Permalink
- Report Inappropriate Content
You don't have to, but if you really want to you can always mark a helpful answer 
Qlik Community Tip: Marking Replies as Correct or Helpful
Best,
Sunny