Unlock a world of possibilities! Login now and discover the exclusive benefits awaiting you.
- Qlik Community
- :
- All Forums
- :
- QlikView App Dev
- :
- Set Analysis - Filter the Dimension and Ignore all...
- Subscribe to RSS Feed
- Mark Topic as New
- Mark Topic as Read
- Float this Topic for Current User
- Bookmark
- Subscribe
- Mute
- Printer Friendly Page
- Mark as New
- Bookmark
- Subscribe
- Mute
- Subscribe to RSS Feed
- Permalink
- Report Inappropriate Content
Set Analysis - Filter the Dimension and Ignore all Filters for SUM
So I have a listing of objects that come from multiple stores. For example I might be able to get a Pencil, a Crayon or a Pen from 10 different stores at all different prices. I have a fact table that lists orders for the last few years.
I would want to be able to filter to just Pencils and one store and show a line in a straight table that says
Object Quantity Ordered Cost
Pencil 100 $10
The above can be done without any Set Analysis and is the default behavior of a straight table.
Now I want to add a column that says the above (filtered to Pencil and 1 store) but also shows the sum of all stores for quantity and cost.
Object Quantity Ordered Cost Total Q Total Cost
Pencil 100 $10 500 $550
When I use {1} to ignore all filters, I get something like this when filtered to 1 store and Pencil. The Crayon and Pen show up even though they have been filtered away. I understand this behavior but how do I prevent it from happening.
Object Quantity Ordered Cost Total Q Total Cost
Pencil 100 $10 500 $550
Crayon 0 0 50 $20
Pen 0 0 1500 $800
I've been reading through community and Tom Mackay's presentation on Set Analysis and haven't been able to come up with an answer. I've been playing with using P() but so far that hasn't given the results I want.
Accepted Solutions
- Mark as New
- Bookmark
- Subscribe
- Mute
- Subscribe to RSS Feed
- Permalink
- Report Inappropriate Content
Try maybe like this:
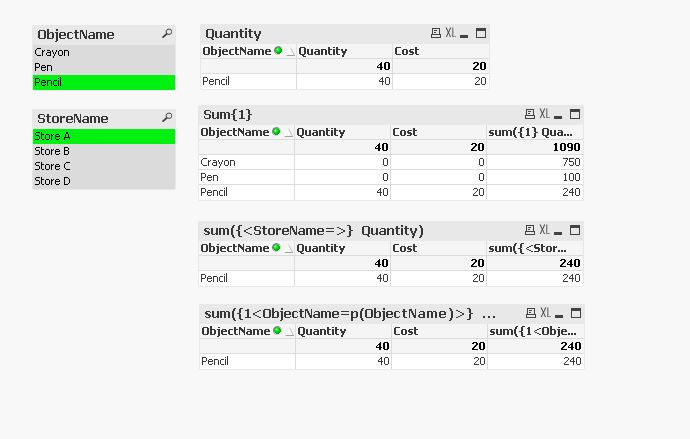
Sum({1<Object = p(Object)>} [Quantity Ordered])
Sum({1<Object = p(Object)>} [Cost])
HTH
Best,
S
- Mark as New
- Bookmark
- Subscribe
- Mute
- Subscribe to RSS Feed
- Permalink
- Report Inappropriate Content
Can you provide few lines of Sample data?
- Mark as New
- Bookmark
- Subscribe
- Mute
- Subscribe to RSS Feed
- Permalink
- Report Inappropriate Content
use {<store=>}
as your set expression for "Total Q and "Total Cost"
This way the set expression will disregard any filter on the store field
- Mark as New
- Bookmark
- Subscribe
- Mute
- Subscribe to RSS Feed
- Permalink
- Report Inappropriate Content
Try maybe like this:
Sum({1<Object = p(Object)>} [Quantity Ordered])
Sum({1<Object = p(Object)>} [Cost])
HTH
Best,
S
- Mark as New
- Bookmark
- Subscribe
- Mute
- Subscribe to RSS Feed
- Permalink
- Report Inappropriate Content
- Mark as New
- Bookmark
- Subscribe
- Mute
- Subscribe to RSS Feed
- Permalink
- Report Inappropriate Content
This one seems to work the best as I start to sprawl out of every option that could be filtered on... this makes the most sense.
I was trying to do the same thing but I failed to put the "1" in the correct place. Attached is the sample with different options being tested.