Unlock a world of possibilities! Login now and discover the exclusive benefits awaiting you.
- Qlik Community
- :
- All Forums
- :
- QlikView App Dev
- :
- Set Analysis - Max Date per customer
Options
- Subscribe to RSS Feed
- Mark Topic as New
- Mark Topic as Read
- Float this Topic for Current User
- Bookmark
- Subscribe
- Mute
- Printer Friendly Page
Turn on suggestions
Auto-suggest helps you quickly narrow down your search results by suggesting possible matches as you type.
Showing results for
Contributor III
2018-01-17
09:54 AM
- Mark as New
- Bookmark
- Subscribe
- Mute
- Subscribe to RSS Feed
- Permalink
- Report Inappropriate Content
Set Analysis - Max Date per customer
Hi,
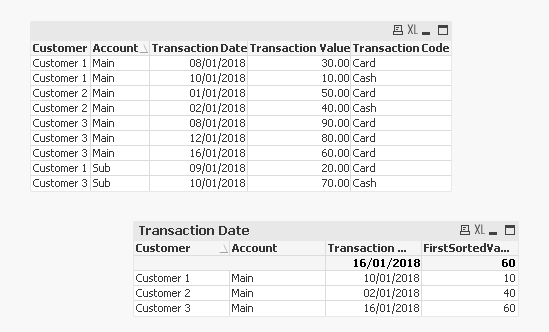
How do I turn the following data into the straight table below.
This set analysis returns a null:
sum({<[Transaction Date]={'$(=max([Transaction Date]))'}, [Account]={'Main'}>} [Transaction Value])
Data
| Customer | Account | Transaction Date | Transaction Value | Transaction Code |
|---|---|---|---|---|
| Customer 1 | Main | 10/01/2018 | £10.00 | Cash |
| Customer 1 | Sub | 09/01/2018 | £20.00 | Card |
| Customer 1 | Main | 08/01/2018 | £30.00 | Card |
| Customer 2 | Main | 02/01/2018 | £40.00 | Cash |
| Customer 2 | Main | 01/01/2018 | £50.00 | Card |
| Customer 3 | Main | 16/01/2018 | £60.00 | Card |
| Customer 3 | Sub | 10/01/2018 | £70.00 | Cash |
| Customer 3 | Main | 12/01/2018 | £80.00 | Card |
| Customer 3 | Main | 08/01/2018 | £90.00 | Card |
Straight table
| Customer | Account | Transaction Date | Transaction Value | Transaction Code |
|---|---|---|---|---|
| Customer 1 | Main | 10/01/2018 | £10.00 | Cash |
| Customer 2 | Main | 02/01/2018 | £40.00 | Cash |
| Customer 3 | Main | 16/01/2018 | £60.00 | Card |
Please can you help?
Thanks,
Darren
2,267 Views
4 Replies
MVP
2018-01-17
09:56 AM
- Mark as New
- Bookmark
- Subscribe
- Mute
- Subscribe to RSS Feed
- Permalink
- Report Inappropriate Content
Try this
FirstSortedValue({<[Account]={'Main'}>} Aggr(Sum({< [Account]={'Main'}>}[Transaction Value]), Customer, [Transaction Date]), -Aggr(Only({< [Account]={'Main'}>} [Transaction Date]), Customer, [Transaction Date]))
MVP
2018-01-17
10:06 AM
- Mark as New
- Bookmark
- Subscribe
- Mute
- Subscribe to RSS Feed
- Permalink
- Report Inappropriate Content
Here is a sample attached
1,895 Views
Contributor III
2018-01-18
08:29 AM
Author
- Mark as New
- Bookmark
- Subscribe
- Mute
- Subscribe to RSS Feed
- Permalink
- Report Inappropriate Content
Hi Sunny,
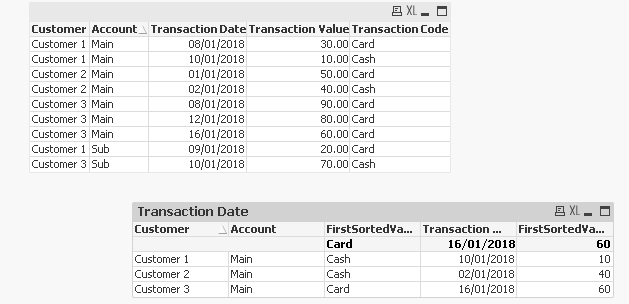
How would I add the Transaction Code so the table displays like this:
| Customer | Account | Transaction Date | FirstSortedValue | Transaction Code |
| 16/01/2018 | 60 | |||
| Customer 1 | Main | 10/01/2018 | 10 | Cash |
| Customer 2 | Main | 02/01/2018 | 40 | Cash |
| Customer 3 | Main | 16/01/2018 | 60 | Card |
When I add the dimension I get extra lines.
| Customer | Account | Transaction Code | Transaction Date | FirstSortedValue |
| 16/01/2018 | 60 | |||
| Customer 1 | Main | Cash | 10/01/2018 | 10 |
| Customer 1 | Main | Card | 08/01/2018 | 30 |
| Customer 2 | Main | Cash | 02/01/2018 | 40 |
| Customer 2 | Main | Card | 01/01/2018 | 50 |
| Customer 3 | Main | Card | 16/01/2018 | 60 |
1,895 Views
MVP
2018-01-18
08:37 AM
- Mark as New
- Bookmark
- Subscribe
- Mute
- Subscribe to RSS Feed
- Permalink
- Report Inappropriate Content
add it as an expression
1,895 Views