Unlock a world of possibilities! Login now and discover the exclusive benefits awaiting you.
- Qlik Community
- :
- All Forums
- :
- QlikView App Dev
- :
- Set Analysis field equals another field for multip...
- Subscribe to RSS Feed
- Mark Topic as New
- Mark Topic as Read
- Float this Topic for Current User
- Bookmark
- Subscribe
- Mute
- Printer Friendly Page
- Mark as New
- Bookmark
- Subscribe
- Mute
- Subscribe to RSS Feed
- Permalink
- Report Inappropriate Content
Set Analysis field equals another field for multiple selections
HI
I have a requirement to calculate Sales for a selected Date and then for the same date (or day) last year based on a value in a corresponding field in the Dates Dimension.
I have inherited this app and it is currently being done using alternative states, triggers and buttons with actions. I wanted to see if I could use set analysis alone to simplify for the user.
To explain the scenario...the Date dimension has the following fields. The transaction date will be the date chosen by the user. The _LYDTE is the corresponding date last year. The _LYDAY is the corresponding Like for Like same day last year.

This joins to the Fact table on the _TransactionDateKey. The fact table has multiple other dimension tables joining to it. This is the structure:
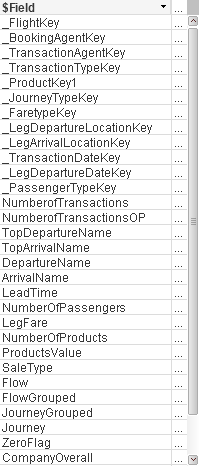
The chart will contain many dimension but ultimately it is summing the field LegFare for the date chosen and then hopefully for the other _LYDTE and _LYCOM
the expressions for the 3 fields are as follows
sum(LegFare)
sum({<TransactionDate={"$(=([_LYDTE]))"}>}LegFare)
sum({<TransactionDate={"$(=([_LYCOM]))"}>}LegFare)
the 2 for last year are resolving correctly as you can see in the column name BUT only when ONE TransactionDate is selected.
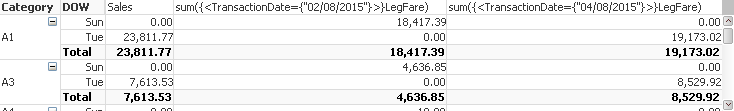
If multiple are selected the 2 last year columns do not calculate

I am hoping someone might have a better suggestion as to how to go about this in the most simplistic way but trying to use the columns that are already in my date dimension. I did look at storing the LY Sales figures as an extra column but it is aggregated across multiple dimensions that is was taking too long too run. The fact table contains 40 million records.
I am starting to go around in circles!
Accepted Solutions
- Mark as New
- Bookmark
- Subscribe
- Mute
- Subscribe to RSS Feed
- Permalink
- Report Inappropriate Content
The problem is I am not going to be able to reload the application without the binary load qvd available to me (and if that file is huge, I wouldn't even want to do that). The As-Of Table solution is a script based solution, which would need me to be able to reload the application.
May be try adding this to your script and reloading it
LinkTable:
LOAD TransactionDate as ReportDate,
TransactionDate,
'CY' as Flag
Resident DimTransactionDate;
Concatenate (LinkTable)
LOAD
TransactionDate as ReportDate,
Date(AddYears(TransactionDate, -1)) as TransactionDate,
'PY' as Flag
Resident DimTransactionDate;
Now all you need to do is, for tables where you are doing a comparison between this year vs. previous year, use ReportDate instead of TransactionDate and within your expressions use them like this:
This Year -> Sum({<Flag = {'CY'}>}Sales)
Last Year -> Sum({<Flag = {'PY'}>}Sales)
- Mark as New
- Bookmark
- Subscribe
- Mute
- Subscribe to RSS Feed
- Permalink
- Report Inappropriate Content
I would suggest using The As-Of Table to simplify this
- Mark as New
- Bookmark
- Subscribe
- Mute
- Subscribe to RSS Feed
- Permalink
- Report Inappropriate Content
Hi Sunny
Thanks for your quick reply 🙂
I am not looking to accumulate though, I am just wanting to have like for like comparisons. I already have the LY dates persisted as columns in the date dimension.
I have never been asked to do this based on a column in the table before and I am coming to the conclusion it isn't possible.
My expression is clearly not bound to the dimensionality of its row within the table.
- Mark as New
- Bookmark
- Subscribe
- Mute
- Subscribe to RSS Feed
- Permalink
- Report Inappropriate Content
The As-of Table can help you with both accumulating and associating with an older date problem. If you can provide a smaple, I might be able to show you how this can be done
- Mark as New
- Bookmark
- Subscribe
- Mute
- Subscribe to RSS Feed
- Permalink
- Report Inappropriate Content
Hi Sunny
I have whittled the app down as much as I can and left in August 2016 and August 2015 data.
you will see the chart where the expression works for one chosen transaction date but not more than one.
thank you for taking the time to try and help
Tracy
- Mark as New
- Bookmark
- Subscribe
- Mute
- Subscribe to RSS Feed
- Permalink
- Report Inappropriate Content
The problem is I am not going to be able to reload the application without the binary load qvd available to me (and if that file is huge, I wouldn't even want to do that). The As-Of Table solution is a script based solution, which would need me to be able to reload the application.
May be try adding this to your script and reloading it
LinkTable:
LOAD TransactionDate as ReportDate,
TransactionDate,
'CY' as Flag
Resident DimTransactionDate;
Concatenate (LinkTable)
LOAD
TransactionDate as ReportDate,
Date(AddYears(TransactionDate, -1)) as TransactionDate,
'PY' as Flag
Resident DimTransactionDate;
Now all you need to do is, for tables where you are doing a comparison between this year vs. previous year, use ReportDate instead of TransactionDate and within your expressions use them like this:
This Year -> Sum({<Flag = {'CY'}>}Sales)
Last Year -> Sum({<Flag = {'PY'}>}Sales)
- Mark as New
- Bookmark
- Subscribe
- Mute
- Subscribe to RSS Feed
- Permalink
- Report Inappropriate Content
I will try this and let you know.
I have been looking at this expression
sum({<TransactionDate={"$(=concat(distinct [_LYDTE],'","'))"}>}LegFare)
it seems to be producing results now for multiple selections but I am yet to validate the answers.
Thanks Sunny 🙂
- Mark as New
- Bookmark
- Subscribe
- Mute
- Subscribe to RSS Feed
- Permalink
- Report Inappropriate Content
Ya no problem. But this is not the technique I am prescribing. I was taking you another route. But if this works for you, then that is great.
- Mark as New
- Bookmark
- Subscribe
- Mute
- Subscribe to RSS Feed
- Permalink
- Report Inappropriate Content
Hi Sunny
I wanted to come back to you on this and say that my solution worked well when using any dimension other than TransactionDate itself. Today I wanted to plot the actual TransactionDate as a dimension and my solution would not line these up correctly.
I revisited your solution and it has worked perfectly.
I wanted to thank you and give you credit for the correct answer