Unlock a world of possibilities! Login now and discover the exclusive benefits awaiting you.
- Qlik Community
- :
- All Forums
- :
- QlikView App Dev
- :
- Re: Set Analysis for YoY
- Subscribe to RSS Feed
- Mark Topic as New
- Mark Topic as Read
- Float this Topic for Current User
- Bookmark
- Subscribe
- Mute
- Printer Friendly Page
- Mark as New
- Bookmark
- Subscribe
- Mute
- Subscribe to RSS Feed
- Permalink
- Report Inappropriate Content
Set Analysis for YoY
Hi Experts,
I have data in following format :
| Year | Month | Value |
| 2013 | Jul | 20 |
| 2014 | Jul | 30 |
| 2013 | Aug | 60 |
| 2014 | Aug | 70 |
I need to use set analysis to display same table in following format :
| Month - Year | Value CY | Value PY |
| Jul-14 | 30 | 20 |
| Aug-14 | 70 | 60 |
How can I achieve the same ?
Thanks,
Sailee
Accepted Solutions
- Mark as New
- Bookmark
- Subscribe
- Mute
- Subscribe to RSS Feed
- Permalink
- Report Inappropriate Content
For multiple years, set analysis would not give you desired result in chart. Better try in the script like:
Input:
load
*,
Year&Month as Key;
Load * Inline [
Year, Month, Value
2013, Jul, 20
2014, Jul, 30
2013, Aug, 60
2014, Aug, 70
] ;
Left Join
Load
Year-1&Month as Key,
Value as PreYValue
Resident Input;
PFA
- Mark as New
- Bookmark
- Subscribe
- Mute
- Subscribe to RSS Feed
- Permalink
- Report Inappropriate Content
Create a variable and name it vCurrentYear and set max(Year) and create another one for last year
create 2 expressions
sum({$<Year={'$(vCurrentYear)'}>} Value)
sum({$<Year={'$(vLastYear)'}>} Value)
and set a calculated dimension Month & '-' & Year
- Mark as New
- Bookmark
- Subscribe
- Mute
- Subscribe to RSS Feed
- Permalink
- Report Inappropriate Content
For multiple years, set analysis would not give you desired result in chart. Better try in the script like:
Input:
load
*,
Year&Month as Key;
Load * Inline [
Year, Month, Value
2013, Jul, 20
2014, Jul, 30
2013, Aug, 60
2014, Aug, 70
] ;
Left Join
Load
Year-1&Month as Key,
Value as PreYValue
Resident Input;
PFA
- Mark as New
- Bookmark
- Subscribe
- Mute
- Subscribe to RSS Feed
- Permalink
- Report Inappropriate Content
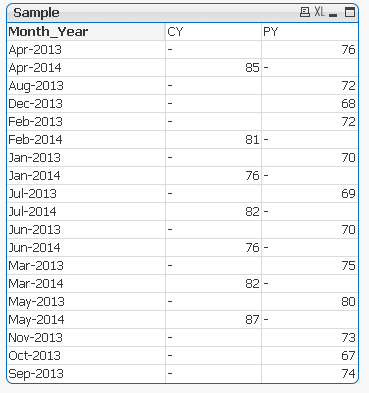
Thanks Yousef. I tried the above, However I get data as shown below. I want Month-Year to show only Month-Current Year and then the columns will have CY and PY data.
- Mark as New
- Bookmark
- Subscribe
- Mute
- Subscribe to RSS Feed
- Permalink
- Report Inappropriate Content
ok, set only month in the dimension and select the month that you want
- Mark as New
- Bookmark
- Subscribe
- Mute
- Subscribe to RSS Feed
- Permalink
- Report Inappropriate Content
Hi Sailee.
I agree with tresesco you cannot achieve that purely by set analisys but I prefer other solution for such problems.
Look at How to trend Current Sales vs Prev Sales, using date as dimension? I believe requirements there are similiar to your's. Look at discussion there - there are several solutions. My solution there (with a sample application) is in creation of special sort of calendar. Good description of that method is at Calendar with flags making set analysis so very simple
- Mark as New
- Bookmark
- Subscribe
- Mute
- Subscribe to RSS Feed
- Permalink
- Report Inappropriate Content
Thanks tresesco and Vadim Tsushko did at the script level .. 
Just have one doubt .. Does preceding loads impact the performance of dashboard ? I do have ample amount of data in the database.
- Mark as New
- Bookmark
- Subscribe
- Mute
- Subscribe to RSS Feed
- Permalink
- Report Inappropriate Content
Yes it does, and does it positively. Preceding load is something that should be used wherever possible rather than resident load.