Unlock a world of possibilities! Login now and discover the exclusive benefits awaiting you.
- Qlik Community
- :
- All Forums
- :
- QlikView App Dev
- :
- Set Analysis on rolling 12 months for Inventory Tu...
- Subscribe to RSS Feed
- Mark Topic as New
- Mark Topic as Read
- Float this Topic for Current User
- Bookmark
- Subscribe
- Mute
- Printer Friendly Page
- Mark as New
- Bookmark
- Subscribe
- Mute
- Subscribe to RSS Feed
- Permalink
- Report Inappropriate Content
Set Analysis on rolling 12 months for Inventory Turnover
Hi all,
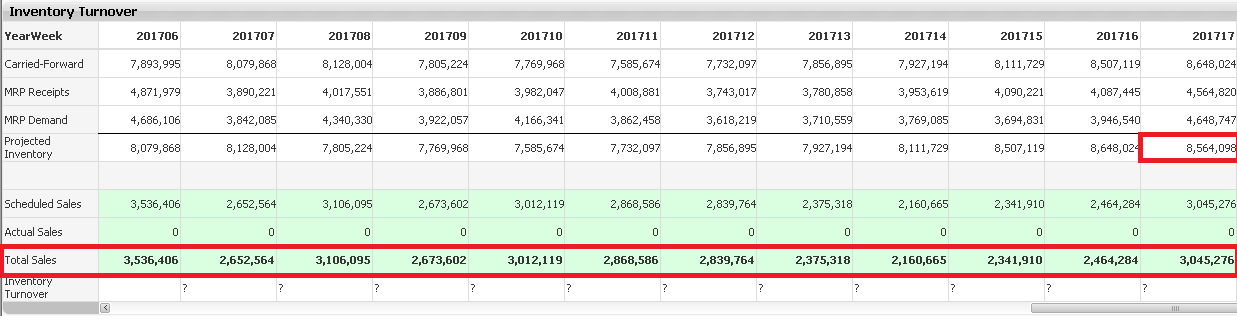
With reference to the below chart I am trying to calculate the Inventory Turnover (where there is a '?') as it was on each Yearweek. This is calculated using the following formula:
Inventory Turnover = [Total Sales] / [Projected Inventory]
The Total Sales for each yearweek can be taken as the sales for the previous 52 weeks.
The Projected Inventory is the upper red box for each equivalent yearweek.
So for example, the Inventory Turnover value for 201717 should show 8564098/[Sum of Sales for the last 52 weeks]
Since set analysis is calculated only once per chart I am finding it a problem to find the [Sum of Sales for the last 52 weeks] for each and every yearweek.
Any suggestions how this can be achieved?
I also attached the document as it might help.
Thanks!
Accepted Solutions
- Mark as New
- Bookmark
- Subscribe
- Mute
- Subscribe to RSS Feed
- Permalink
- Report Inappropriate Content
Does this look right?
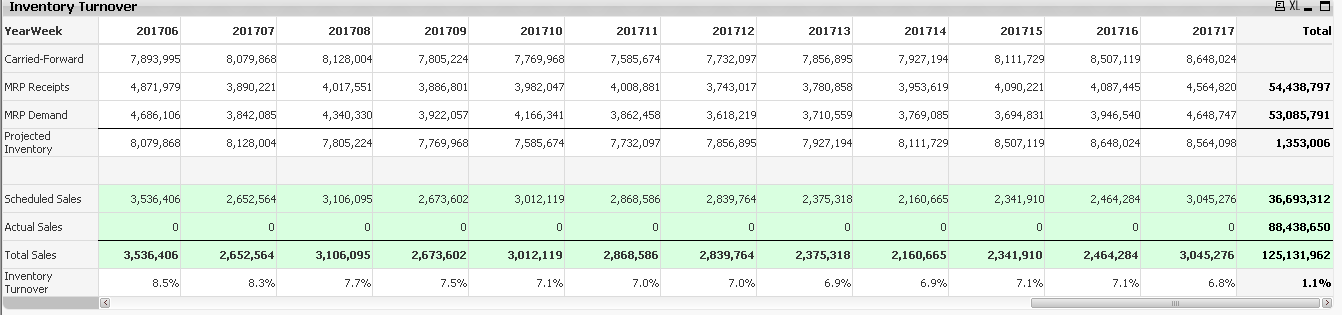
Expression:
([MRP Receipts] + IF(IsNull([Carried-Forward]), 0, [Carried-Forward]) - [MRP Demand])/RangeSum((Before([Actual Sales] + [Scheduled Sales], 0, 52)))
- Mark as New
- Bookmark
- Subscribe
- Mute
- Subscribe to RSS Feed
- Permalink
- Report Inappropriate Content
Does this look right?
Expression:
([MRP Receipts] + IF(IsNull([Carried-Forward]), 0, [Carried-Forward]) - [MRP Demand])/RangeSum((Before([Actual Sales] + [Scheduled Sales], 0, 52)))
- Mark as New
- Bookmark
- Subscribe
- Mute
- Subscribe to RSS Feed
- Permalink
- Report Inappropriate Content
Awesome Sunny. Although the formula that I want is different from what you provided you still gave me the answer.
RangeSum((Before([Total Sales], 0, 52)))/[Projected Inventory]
I used the 'before' function before I didn't know that it can take more than one parameter!!
Always learning 