Unlock a world of possibilities! Login now and discover the exclusive benefits awaiting you.
- Qlik Community
- :
- All Forums
- :
- QlikView App Dev
- :
- Set Analysis to include Nulls by Join (not Nulls i...
- Subscribe to RSS Feed
- Mark Topic as New
- Mark Topic as Read
- Float this Topic for Current User
- Bookmark
- Subscribe
- Mute
- Printer Friendly Page
- Mark as New
- Bookmark
- Subscribe
- Mute
- Subscribe to RSS Feed
- Permalink
- Report Inappropriate Content
Set Analysis to include Nulls by Join (not Nulls in same table)
Hi all,
Here's one that I feel should be doable but I can't get it working! Hoping you can help...
Here's my data model:
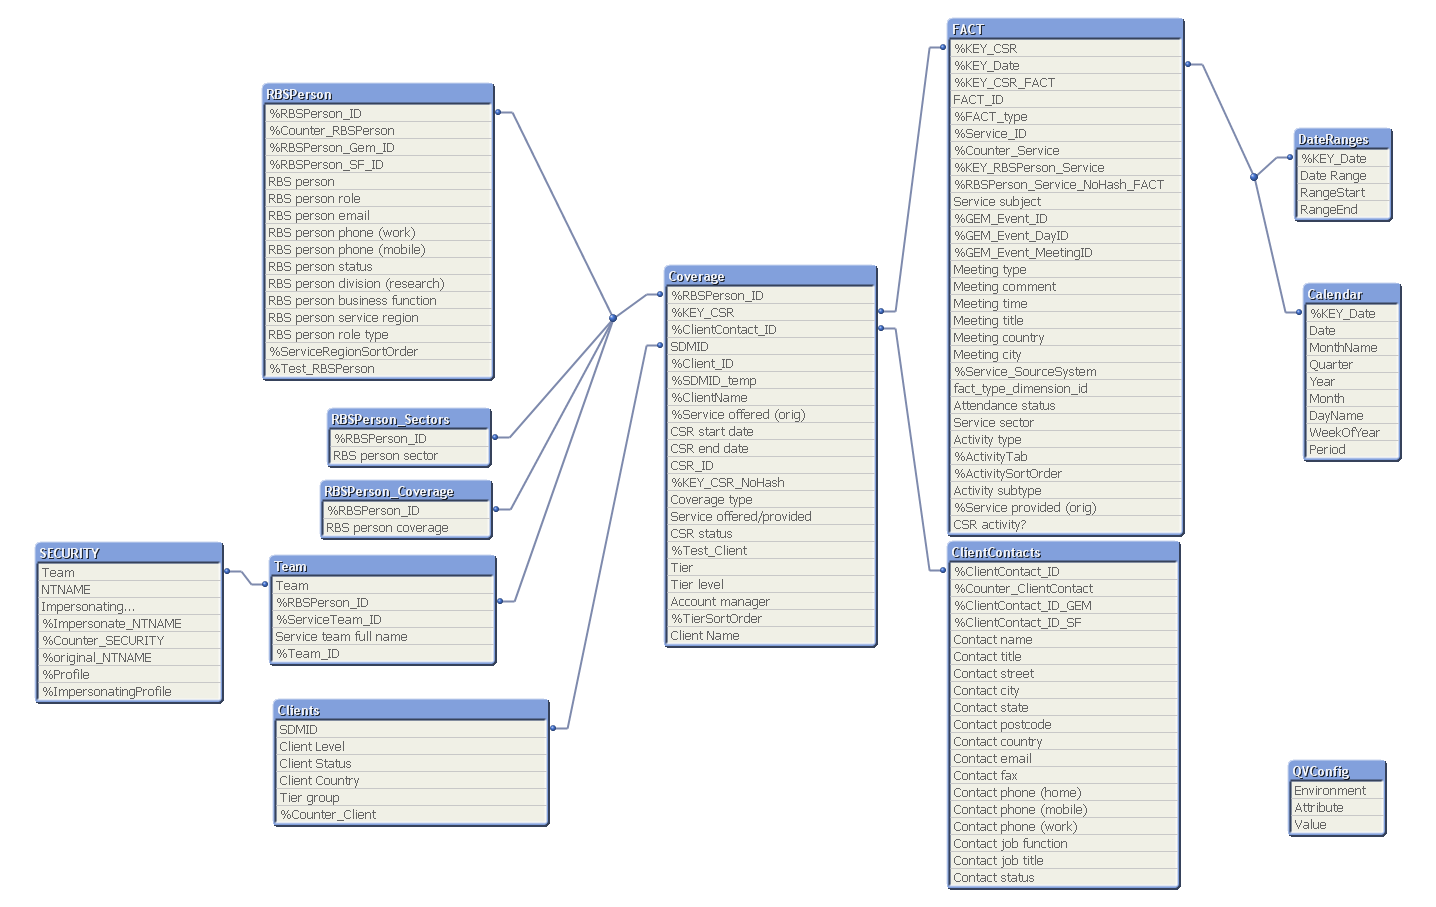
Now, I need a straight table chart that shows every record in the Coverage table, and a countof the associated records in the FACT table - from SUM(%Counter_Service) - with the following specific requirements:
- All records in the Coverage table must be shown, with all selections removed, except some specific fields. E.g. let's say there are 1000 records in the coverage table, but only 100 of them relate to a specific RBS person selected in the RBSPerson table (e.g. Bob Smith) - the chart should have 100 rows if Bob Smith is selected.
- Zero values must be included. So following on from the previous example, of the 100 Coverage records relating to Bob Smith, let's say only 75 have any tranasactions associated to them. So the 100 rows of the chart must show 75 rows with a +ve integer against them and 25 rows with a zero.
Up to now this isn't too difficult - I have used some Set Analysis (in conjunction with unchecking "Suppress zero values") which is working just fine:
NUM(SUM({1<%RBSPerson_ID=P(),%Client_ID=P(),%ClientContact_ID=P(),[Service offered/provided]=P() >}%Counter_Service),'#,##0')
HOWEVER! I need to add one other field back into the Set Analysis expression given above. But this is from the FACT table - %ActivityTab. What I am trying to acheive is to limit the SUM to only those FACT records where %ActivityTab = "Svc". The problem is that this expression:
NUM(SUM({1<%RBSPerson_ID=P(),%Client_ID=P(),%ClientContact_ID=P(),[Service offered/provided]=P(), %ActivityTab={Svc} >}%Counter_Service),'#,##0')
results in my zero values being excluded. This is quite obvious I guess - there will only be a value for %ActivityTab where there is a FACT record. But I need to retain the zeros! So what I need to achieve is a results set where %ActivityTab is EITHER "Svc" OR Null; but Null based on the join, not a Null() value.
Phew! Hope that's clear and one of you very clever folk can help me.
Thanks in advance,
Jason
- Tags:
- null
- set_analysis