Unlock a world of possibilities! Login now and discover the exclusive benefits awaiting you.
- Qlik Community
- :
- All Forums
- :
- QlikView App Dev
- :
- Re: Set Analysis with List Box Selections
- Subscribe to RSS Feed
- Mark Topic as New
- Mark Topic as Read
- Float this Topic for Current User
- Bookmark
- Subscribe
- Mute
- Printer Friendly Page
- Mark as New
- Bookmark
- Subscribe
- Mute
- Subscribe to RSS Feed
- Permalink
- Report Inappropriate Content
Set Analysis with List Box Selections
Hi all,
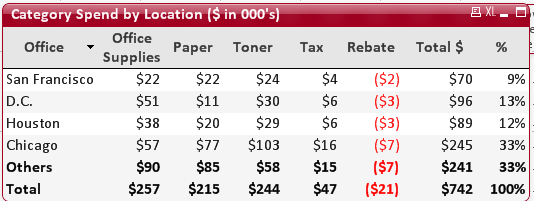
I have a list box and a straight table, both in a state called "OfficeSupplyState." When I have no selections made, I expect the below outcome in the table. When I click on one of the categories in the list box, I expect all the numbers in that category to stay the same, but the values in the remaining categories to go to zero. Eventually, I want to hide the columns that are not selected, but I have that condition turned off while I debug.
The problem I am having is that my table is completely static, no matter which selection is made in the list box. Below is an example expression from my "Office Supplies" column; the other columns are similar. Please help!
=(sum({[OfficeSupplyState]<Category1 = {'Office Supplies'}>}PriceUnitTotal)/1000)*$(vAdjustmentFactor)
![]()
Accepted Solutions
- Mark as New
- Bookmark
- Subscribe
- Mute
- Subscribe to RSS Feed
- Permalink
- Report Inappropriate Content
See attached example. The above chart uses an if statement so only sums are returned for the selected years. The below chart shows only the columns for the selected years using the conditional display expressions for expressions. This requires QV 11 or higher.
talk is cheap, supply exceeds demand
- Mark as New
- Bookmark
- Subscribe
- Mute
- Subscribe to RSS Feed
- Permalink
- Report Inappropriate Content
Pretty slick; thanks for the response. So there's no good way to do this using set analysis?
-Paul
- Mark as New
- Bookmark
- Subscribe
- Mute
- Subscribe to RSS Feed
- Permalink
- Report Inappropriate Content
I struggled with a related problem that might help point you to a solution. Users wanted only one list box (out of 10 or so) to act on an object. I think alternate states would have been helpful, but they give me a headache. It might not be the best way, but it seems to work.
Sum({1<[Segment Name] = {$(=If(GetSelectedCount([Segment Name]) = 0,
Chr(39) & '*' & Chr(39),
Concat (Distinct Chr(39) & [Segment Name] & Chr(39),',')))}
>}[Net Price])
I have the full explanation on my blog if you're interested... http://fortunecookiebi.blogspot.com/2013/06/the-one.html