Unlock a world of possibilities! Login now and discover the exclusive benefits awaiting you.
- Qlik Community
- :
- All Forums
- :
- QlikView App Dev
- :
- Set analysis in chart
- Subscribe to RSS Feed
- Mark Topic as New
- Mark Topic as Read
- Float this Topic for Current User
- Bookmark
- Subscribe
- Mute
- Printer Friendly Page
- Mark as New
- Bookmark
- Subscribe
- Mute
- Subscribe to RSS Feed
- Permalink
- Report Inappropriate Content
Set analysis in chart
I need to have a set analysis function based on the dimension of the chart. I tried this and does not seem to work.
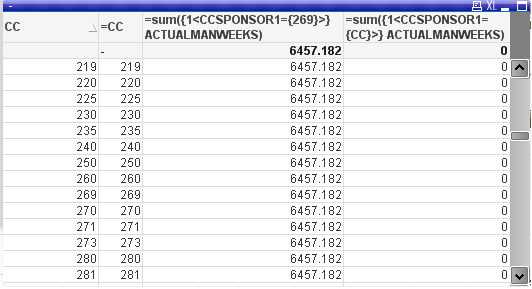
first column - CC is my dimension.
I have added 3 expression columns to make my question clear.
On row for CC 269, i was expcting column 4 to have 6457.182.
Please help!
Accepted Solutions
- Mark as New
- Bookmark
- Subscribe
- Mute
- Subscribe to RSS Feed
- Permalink
- Report Inappropriate Content
Set analysis expressions are evaluated per chart, not per row. So you can't use CC both as dimension in your chart and in your set analysis expression. You'll have to use hardcoded values or if statements. See here for more information.
talk is cheap, supply exceeds demand
- Mark as New
- Bookmark
- Subscribe
- Mute
- Subscribe to RSS Feed
- Permalink
- Report Inappropriate Content
Hi,
Try using this with Aggr(). try this expression
=Sum(Aggr(If(CCSPONSOR1 = [CC], Sum(ACTUALMANWEEKS), 0), CCSPONSOR1))
Hope this helps you.
Regards,
Jagan.
- Mark as New
- Bookmark
- Subscribe
- Mute
- Subscribe to RSS Feed
- Permalink
- Report Inappropriate Content
Set analysis expressions are evaluated per chart, not per row. So you can't use CC both as dimension in your chart and in your set analysis expression. You'll have to use hardcoded values or if statements. See here for more information.
talk is cheap, supply exceeds demand
- Mark as New
- Bookmark
- Subscribe
- Mute
- Subscribe to RSS Feed
- Permalink
- Report Inappropriate Content
Hi Jagan,
No, that did not work. It gave exact same result as
=sum({1<CCSPONSOR1=CC>} ACTUALMANWEEKS)

Thanks
- Mark as New
- Bookmark
- Subscribe
- Mute
- Subscribe to RSS Feed
- Permalink
- Report Inappropriate Content
Thanks!