Unlock a world of possibilities! Login now and discover the exclusive benefits awaiting you.
- Qlik Community
- :
- All Forums
- :
- QlikView App Dev
- :
- Set analysis syntax for multi year
- Subscribe to RSS Feed
- Mark Topic as New
- Mark Topic as Read
- Float this Topic for Current User
- Bookmark
- Subscribe
- Mute
- Printer Friendly Page
- Mark as New
- Bookmark
- Subscribe
- Mute
- Subscribe to RSS Feed
- Permalink
- Report Inappropriate Content
Set analysis syntax for multi year
Hi,
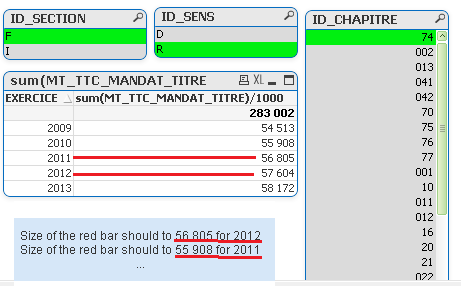
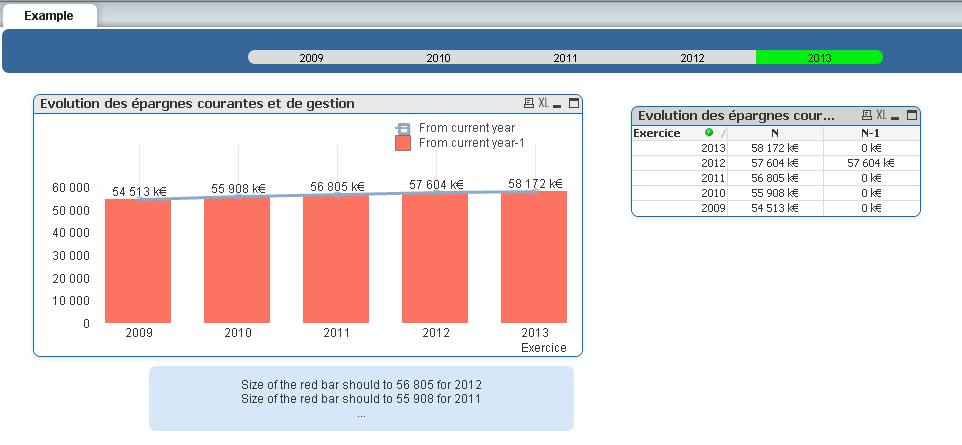
I have created a chart (simplified in the example herejoined) which display a mesure for 5 years (the selected one and the 4 years before).
In this chart I would like to display the value of the year (it works...) and the value of the year before (and it doesn't works).
I am not sure it is possible... Could you please help ?
Thanks a lot !
- Tags:
- set
- set-analysis
- Mark as New
- Bookmark
- Subscribe
- Mute
- Subscribe to RSS Feed
- Permalink
- Report Inappropriate Content
for years use expression in set analysis like
current year
sum( {$<EXERCICE = {$(#=max(EXERCICE))}>} Sales )
previous year
sum( {$<EXERCICE = {$(#=max(EXERCICE)-1)}>} Sales )
hope it helps
Sri1
- Mark as New
- Bookmark
- Subscribe
- Mute
- Subscribe to RSS Feed
- Permalink
- Report Inappropriate Content
maybe
= Sum ( {$ <EXERCICE={">=$(=max(EXERCICE)-5)<=$(=max(EXERCICE)-0)"},ID_CHAPITRE= {"74"}, ID_SECTION={"F"}, ID_SENS={"R"} > } MT_TTC_MANDAT_TITRE)
- Mark as New
- Bookmark
- Subscribe
- Mute
- Subscribe to RSS Feed
- Permalink
- Report Inappropriate Content
as per the comment mentioned in the text object, do you want to display the value of prev year in the next yr that means do you want to show the value of 2011 (56 805) in the year 2012. As per your data the chart is currently showing correct values. I did a simple selection and found it. Please confirm.
- Mark as New
- Bookmark
- Subscribe
- Mute
- Subscribe to RSS Feed
- Permalink
- Report Inappropriate Content
Thanks a lot for your answer !
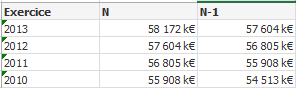
I would like to have both value in the table : N and N-1, just as in the table hereafter :
- Mark as New
- Bookmark
- Subscribe
- Mute
- Subscribe to RSS Feed
- Permalink
- Report Inappropriate Content
Thanks a lot for your answer.
It may not work as I would like to have the value for each year, and not only for the year before the current year
(in the example herafter, with your formula, I retrieve only one value. I don't want to create 5 expression but only one)
The expected result :

Thank you