Unlock a world of possibilities! Login now and discover the exclusive benefits awaiting you.
- Qlik Community
- :
- All Forums
- :
- QlikView App Dev
- :
- Re: Show Max Value in Pivot Chart
- Subscribe to RSS Feed
- Mark Topic as New
- Mark Topic as Read
- Float this Topic for Current User
- Bookmark
- Subscribe
- Mute
- Printer Friendly Page
- Mark as New
- Bookmark
- Subscribe
- Mute
- Subscribe to RSS Feed
- Permalink
- Report Inappropriate Content
Show Max Value in Pivot Chart
Hi,
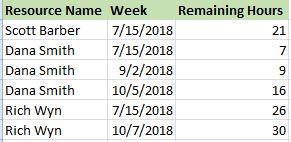
I have a chart with ResourceName and FutureWeeks as dimensions and RemainingHours as an expression.
Brief Background:
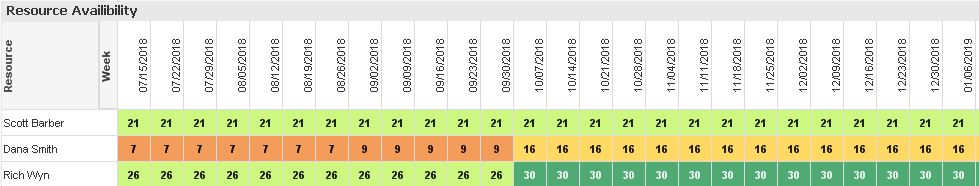
The expression is written in such a way that whenever a project ends, the average hours (which the resource had been charging) for that project is released and added to the RemainingHours (ForecastDate dimension has been dragged over the top to show it vertically).
Dana Smith:
In week of 09/02, one project ends so RemainingHours increases by 2 hours. So RemainingHours will be 9 till the time next project ends (which is in week of 09/30)
In week of 09/30, another project ends and RemainingHours increases by 7 hours. So RemainingHours will be 16 till the time next project ends. (I'm showing RemainingHours for future 26 weeks (6 months)).
My requirement is to show only those weeks where there is a change in RemainingHours.
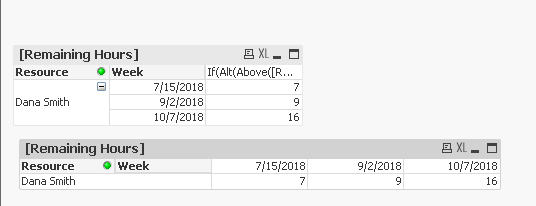
So for above snapshot, I should get '7' for 07/15, '9' for 09/02 and '16' for 10/07.
Basically, show only the weeks where the RemainingHours change.
Is there a way to do this. I hope I have made my requirement clear.
Any help would be appreciated!
Thanks,
Yash
- Mark as New
- Bookmark
- Subscribe
- Mute
- Subscribe to RSS Feed
- Permalink
- Report Inappropriate Content
Would you be able to share a sample to try out few things?
- Mark as New
- Bookmark
- Subscribe
- Mute
- Subscribe to RSS Feed
- Permalink
- Report Inappropriate Content
Hi Sunny,
I have added a sample app in the question. I tried using FirstSortValue but it didnt work.
I have created a copy of the chart in the test app (2 copies- one where Week is represented vertically and other where week is horizontally).
Thanks,
YASH
- Mark as New
- Bookmark
- Subscribe
- Mute
- Subscribe to RSS Feed
- Permalink
- Report Inappropriate Content
Try this for straight table
If(Alt(Above([Remaining Hours]), [Remaining Hours] - 1) <> [Remaining Hours], [Remaining Hours])
This for Pivot table
If(Alt(Before([Remaining Hours]), [Remaining Hours] - 1) <> [Remaining Hours], [Remaining Hours])