Unlock a world of possibilities! Login now and discover the exclusive benefits awaiting you.
- Qlik Community
- :
- All Forums
- :
- QlikView App Dev
- :
- Show Partial Sums - Ignore where value is forced t...
- Subscribe to RSS Feed
- Mark Topic as New
- Mark Topic as Read
- Float this Topic for Current User
- Bookmark
- Subscribe
- Mute
- Printer Friendly Page
- Mark as New
- Bookmark
- Subscribe
- Mute
- Subscribe to RSS Feed
- Permalink
- Report Inappropriate Content
Show Partial Sums - Ignore where value is forced to 0 in expression in Pivot table with RangeMax
I would appreciate some urgent help with this.
I have negative values that I forced to 0 in a expression
RangeMax(0, sum((FORMPERCENTAGE * Quantity)/100))
And this works fine and convert the negative values to 0 as it should, but when I do a partial sum on the dimension it calculates the sum of values in the column as if there is still negative values.
This cause my totals to be incorrect.
Below is the column that I have exported to excel to test the total. The yellow is the negative fields that display 0 as it should. The blue is the total value that I get from show partial sums on the dimension and the green value is the total that I get when I calculate it in excel.
I am stuck with this one and it has serious implications on the results of important reports.
Am I missing something here? I am using this pivot table also in a qlikview report.
orders |
1,419 |
1,419 |
11 |
6 |
53 |
1 |
6 |
31 |
26 |
16 |
77 |
92 |
20 |
10 |
35 |
1 |
0 |
0 |
82 |
15 |
125 |
7 |
18 |
73 |
20 |
6 |
146 |
21 |
140 |
40 |
4 |
9 |
18 |
21 |
21 |
37 |
10 |
15 |
11 |
60 |
12 |
17 |
20 |
55 |
7 |
42 |
1,436 |
- Mark as New
- Bookmark
- Subscribe
- Mute
- Subscribe to RSS Feed
- Permalink
- Report Inappropriate Content
A pivot table, and also straight tables by default, reevaluate your expression for the total row instead of doing a sum of rows. A straight table lets you override this default behavior directly and tell it you want a sum of rows. A pivot table doesn't let you do that. So you have to build your "sum of rows" manually using sum(aggr()). Like this, putting in your dimensions instead of what I listed:
sum(aggr(RangeMax(0, sum((FORMPERCENTAGE * Quantity)/100)),YourFirstDimension,YourSecondDimension,etc.))
- Mark as New
- Bookmark
- Subscribe
- Mute
- Subscribe to RSS Feed
- Permalink
- Report Inappropriate Content
hi louwter,
If i get got you right, you should be getting the total as 1436 instead of 1419. Just a thought, you can restrict your field in such a way so that it just ignores negative values.You can try somrthing like this:
If(FORMPERCENTAGE<>0,Sum(FORMPERCENTAGE)).
This way You can totally exclude negative values from the field.Hope that was helpful.
- Mark as New
- Bookmark
- Subscribe
- Mute
- Subscribe to RSS Feed
- Permalink
- Report Inappropriate Content
Thanks so much John, it worked 100%
- Mark as New
- Bookmark
- Subscribe
- Mute
- Subscribe to RSS Feed
- Permalink
- Report Inappropriate Content
Hello,
I have a similar but more complex problem.
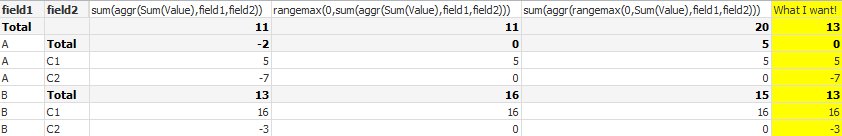
I would like to use the rangemax function only on the outer level.
The picture below should clarify this enough. As you can see, I tried with different syntax, but I am not able to get what I want...
Thanks!
Paolo
- Mark as New
- Bookmark
- Subscribe
- Mute
- Subscribe to RSS Feed
- Permalink
- Report Inappropriate Content
Perhaps use dimensionality(). Your outer level should have dimensionality()=1, and the inner level 2. So this, maybe?
if(dimensionality()=2,sum(Value),rangemax(0,sum(aggr(sum(Value),field1,field2))))
But I get the feeling I'm missing something about your data, because some numbers in your chart don't make sense to me. For instance, I'd have expected your second column B total to be 13. If the expression above fails (I guess it'll give you 16 instead of 13 for the B total), posting a sample qvw might help.
- Mark as New
- Bookmark
- Subscribe
- Mute
- Subscribe to RSS Feed
- Permalink
- Report Inappropriate Content
Thank you, but unfortunately the result is the same.
Actually, my formula is much more complex and difficult to explain and the file is huge, so I tried to simplify as much as possibile.
Anyway, I got rid of everything is not relevant to my problem and I reduced the qvw to few values, so I could attach a file.
In the example, the result I would like is 62....
Thanks
- Mark as New
- Bookmark
- Subscribe
- Mute
- Subscribe to RSS Feed
- Permalink
- Report Inappropriate Content
Update: some combination of dimensionality, rangemax, aggr, causes Qv to crash!
OK, I am asking too much....
- Mark as New
- Bookmark
- Subscribe
- Mute
- Subscribe to RSS Feed
- Permalink
- Report Inappropriate Content
Sorry, my file has an Access section
use paolo/paolo77 as credential.
- Mark as New
- Bookmark
- Subscribe
- Mute
- Subscribe to RSS Feed
- Permalink
- Report Inappropriate Content
Man! You are GREAT! Thanks, i was trying something with a similar problem and the solution is "So you have to build your "sum of rows" manually using sum(aggr())",
Thanks again.