Unlock a world of possibilities! Login now and discover the exclusive benefits awaiting you.
- Qlik Community
- :
- All Forums
- :
- QlikView App Dev
- :
- Show all data point values in the bar chart
- Subscribe to RSS Feed
- Mark Topic as New
- Mark Topic as Read
- Float this Topic for Current User
- Bookmark
- Subscribe
- Mute
- Printer Friendly Page
- Mark as New
- Bookmark
- Subscribe
- Mute
- Subscribe to RSS Feed
- Permalink
- Report Inappropriate Content
Show all data point values in the bar chart
Hello!
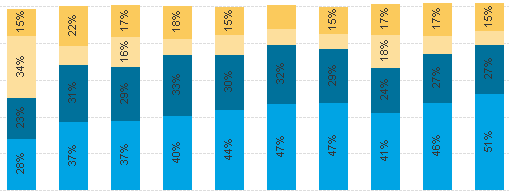
I have a bar chart with values (using Dual function to show percentages, the axis shows actual amounts), however for smaller bars the values do not show, because QlikView "decides" that there is no enough space to show the value - see screenshot below. Is there a way to force all values to be shown?
Thank you in advance for your help,
Jacek
Accepted Solutions
- Mark as New
- Bookmark
- Subscribe
- Mute
- Subscribe to RSS Feed
- Permalink
- Report Inappropriate Content
May be uncheck vertical for values on data points in presentation tab and see?.
- Mark as New
- Bookmark
- Subscribe
- Mute
- Subscribe to RSS Feed
- Permalink
- Report Inappropriate Content
May be uncheck vertical for values on data points in presentation tab and see?.
- Mark as New
- Bookmark
- Subscribe
- Mute
- Subscribe to RSS Feed
- Permalink
- Report Inappropriate Content
Thank you! It works, I can see all values (with the exception of one or two that represent the smallest chunks, but that should be OK). Now I need to convince the users to look at the percentage without tilting their heads left by 90 degrees  .
.
- Mark as New
- Bookmark
- Subscribe
- Mute
- Subscribe to RSS Feed
- Permalink
- Report Inappropriate Content
Glad it worked for you.