Unlock a world of possibilities! Login now and discover the exclusive benefits awaiting you.
- Qlik Community
- :
- All Forums
- :
- QlikView App Dev
- :
- Re: Show average in diagram
- Subscribe to RSS Feed
- Mark Topic as New
- Mark Topic as Read
- Float this Topic for Current User
- Bookmark
- Subscribe
- Mute
- Printer Friendly Page
- Mark as New
- Bookmark
- Subscribe
- Mute
- Subscribe to RSS Feed
- Permalink
- Report Inappropriate Content
Show average in diagram
Hey! 🙂
I have a question - i have the following problem.
I have a table with the following details:
TicketID,
StartDate,
EndDate,
Employee,
Role
Now what i want to do is to make a diagram (bar chart / line chart). In bars i want to show in calendar weeks, how many tickets were started -> there i made an calculated dimension (WeekName(StartDate)) and so got for every calendar weeks the started tickets - in the formula i used a count to count the tickets.
Now what i want is to show in a line the average - how many tickets were started in average.
And if i select an emloyee i want to see these average for his role and if no employee is selected i want to see the average over all roles.
Sometime it is so, that over the year an employee can change his role - than i watn to see the average for both roles.
I dont now how i should do this.
I hope you can help me. 🙂
- Mark as New
- Bookmark
- Subscribe
- Mute
- Subscribe to RSS Feed
- Permalink
- Report Inappropriate Content
No ideas? 😞
- Mark as New
- Bookmark
- Subscribe
- Mute
- Subscribe to RSS Feed
- Permalink
- Report Inappropriate Content
a sample would be helpful ....
Within the datamodel you should link the Employee with his role.
When an Employee is selected, automatically his role(s) will be selected as well.
Expression then may look like:
COUNT({$<Employee = >} Ticket) / COUNT(DISTINCT WeekName)
Expression will count the tickets with the current selections, but not considering the Employee-selection, but it will consider the roles linked with the employee.
Peter
- Mark as New
- Bookmark
- Subscribe
- Mute
- Subscribe to RSS Feed
- Permalink
- Report Inappropriate Content
hey i already linked the employee to his role 🙂
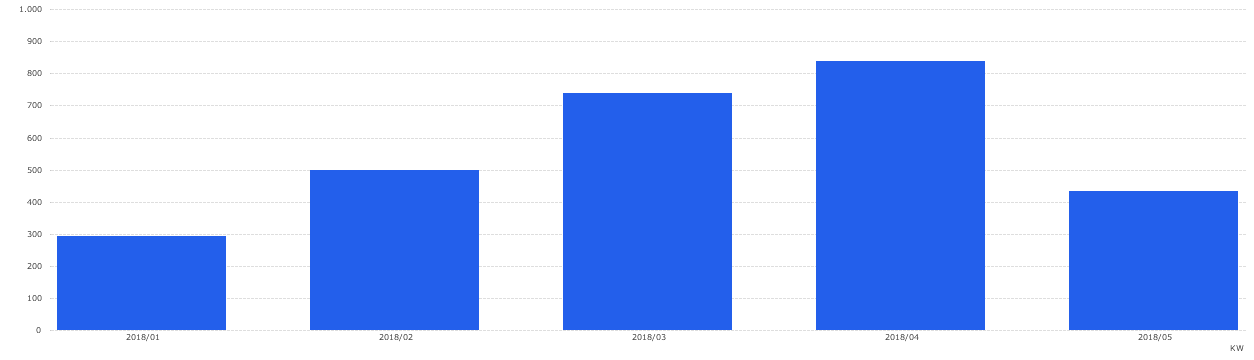
This is what i have now .. i have per calendarweek the started tickets
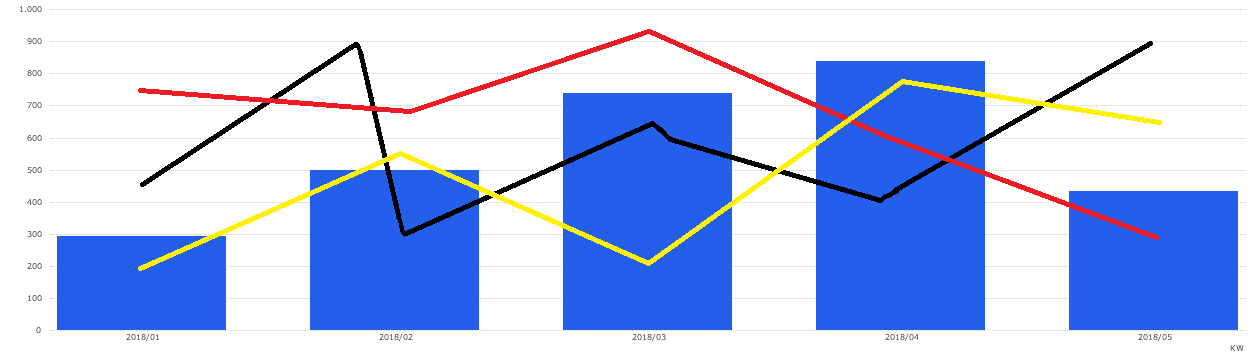
Now what i want is, if no employee is selected i want the average started tickets per role .. it shoudl look like this
For the first diagram i have a calculated dimension -> WeekName(StartDate) and in the formula a count the started tickets
Now i dont know how i should realize the second diagram. If no employee is selcted i want to see the average started tcikets per role (there are 3 roles in total).
Employee and Role are already linked in the data model.
- Mark as New
- Bookmark
- Subscribe
- Mute
- Subscribe to RSS Feed
- Permalink
- Report Inappropriate Content
can you post an example.
On first glance, you only need to have Role as Dimension
- Mark as New
- Bookmark
- Subscribe
- Mute
- Subscribe to RSS Feed
- Permalink
- Report Inappropriate Content
Hey Peter .. i already managed it! 🙂
I used WeekName(StartDate) as Dimension an created 4 formulas .. one where i count the tickets and show the started tickets and 3 for every role where i divided the sum of tickets for each role trough the numbers of employee which are linked to the role.