Unlock a world of possibilities! Login now and discover the exclusive benefits awaiting you.
- Qlik Community
- :
- All Forums
- :
- QlikView App Dev
- :
- Show different types of data, down several rows
- Subscribe to RSS Feed
- Mark Topic as New
- Mark Topic as Read
- Float this Topic for Current User
- Bookmark
- Subscribe
- Mute
- Printer Friendly Page
- Mark as New
- Bookmark
- Subscribe
- Mute
- Subscribe to RSS Feed
- Permalink
- Report Inappropriate Content
Show different types of data, down several rows
Hi, I've a table to create, which contains different types of data for approx 3-4 rows.
Row 1 is sales in £
Row 2 is Market Share (as a %)
Row 3 is Total Market/MarketShare (as an int)
etc as well as totals by territory, then region.
e.g.
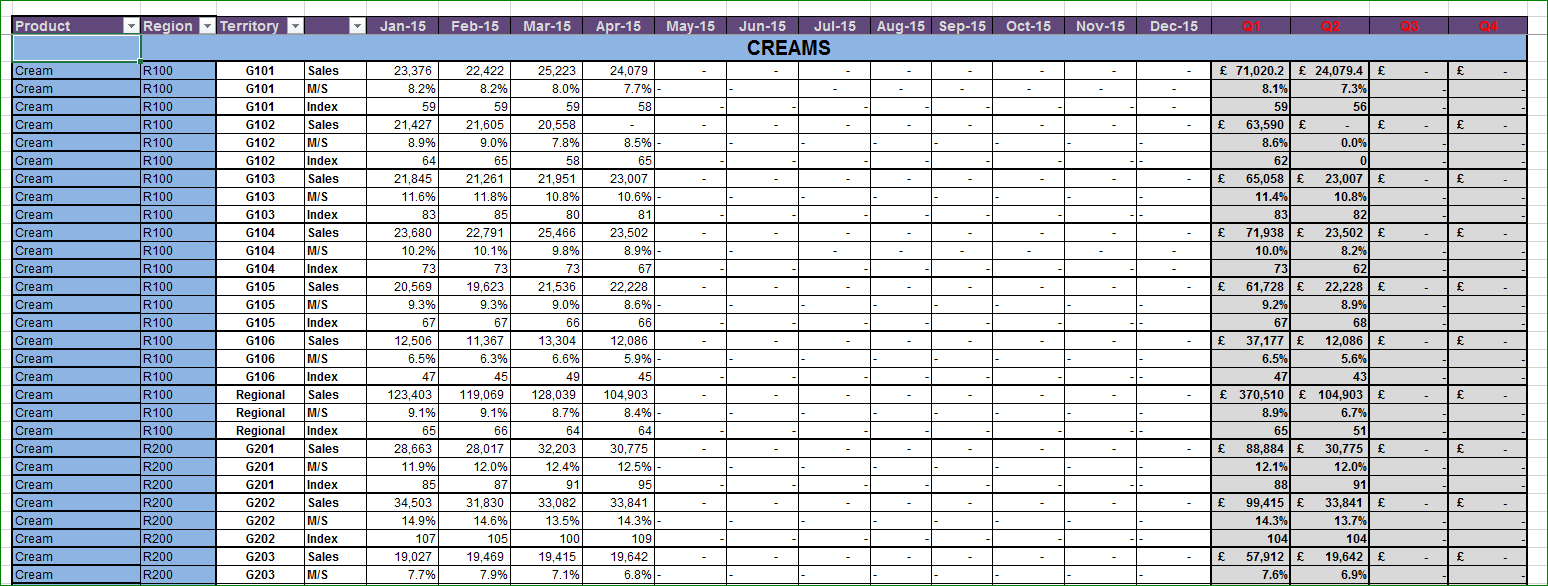
The Sales are regional, so i also need to group/sum each region and row type.
The data comes from 1 table, which is populated by a stored proc, contains all of the data/columns, I just need to organise it (otherwise it's a massive horizontal scrolling exercise due to the number of columns!). I don't know/think a pivot table would quite do it.
Any help greatly appreciated otherwise I may have to resort to SSRS!
Thanks in advance,
Dan
Accepted Solutions
- Mark as New
- Bookmark
- Subscribe
- Mute
- Subscribe to RSS Feed
- Permalink
- Report Inappropriate Content
Hi,
The attached file may be give an idea.
1. Try with CrossTable
2.
LOAD
Territory, Region, Brand as Product,Period,
if(not WildMatch(Period,'Q*'),Left(Period,3),Left(Period,2)) as Month_Qtr,
if(not WildMatch(Period,'Q*'),Mid(Period,4,Len(Period)),Mid(Period,3,Len(Period))) as Type,Data as Sales Resident A ;
- Mark as New
- Bookmark
- Subscribe
- Mute
- Subscribe to RSS Feed
- Permalink
- Report Inappropriate Content
Can u share sample data ?
- Mark as New
- Bookmark
- Subscribe
- Mute
- Subscribe to RSS Feed
- Permalink
- Report Inappropriate Content
Hi, yes see attached sample.xls file for some sample data tab for the data structure as well as the required output.
Thanks
- Mark as New
- Bookmark
- Subscribe
- Mute
- Subscribe to RSS Feed
- Permalink
- Report Inappropriate Content
The easiest way would be to use a normal pivot-chart in qlikview which contained Product, Region and Territory as vertically dimensions as well as your expressions are vertically and quarter and month as horizontally dimensions.
The layout will be slightly different from your (excel) screenshot because the quarter are inside the month and not to their end. If you want to gain a layout which is nearer to your screenshot you will need your expressions as calculated dimension with valuelist(exp1, exp2, exp3) and needs for each month and quarter then an own expression which refers to the time-period and to the valuelist().
- Marcus
- Mark as New
- Bookmark
- Subscribe
- Mute
- Subscribe to RSS Feed
- Permalink
- Report Inappropriate Content
Hi Dan,
RawCross:
CrossTable(Type, Value, 3)
LOAD *
FROM
(ooxml, embedded labels, table is Data);
Creams:
Load *,Type as Test,replace(Replace(Replace(Replace(Type,'BrandSales',''),'MS',''),'TotalMarket',''),'Lvl','') as IndexPeriod,
if(SubStringCount(Type,'BrandSales')>0,'Brand Sales',
if(SubStringCount(Type,'MS')>0,'MS',
if(SubStringCount(Type,'TotalMarket')>0,'Total Market'))) as IndexType
Resident RawCross;
drop table RawCross;
Hope this helps
- Mark as New
- Bookmark
- Subscribe
- Mute
- Subscribe to RSS Feed
- Permalink
- Report Inappropriate Content
Hi,
The attached file may be give an idea.
1. Try with CrossTable
2.
LOAD
Territory, Region, Brand as Product,Period,
if(not WildMatch(Period,'Q*'),Left(Period,3),Left(Period,2)) as Month_Qtr,
if(not WildMatch(Period,'Q*'),Mid(Period,4,Len(Period)),Mid(Period,3,Len(Period))) as Type,Data as Sales Resident A ;
- Mark as New
- Bookmark
- Subscribe
- Mute
- Subscribe to RSS Feed
- Permalink
- Report Inappropriate Content
Setu, that looks like it may well be the solution.
Thanks for your help.
Dan