Unlock a world of possibilities! Login now and discover the exclusive benefits awaiting you.
- Qlik Community
- :
- All Forums
- :
- QlikView App Dev
- :
- Show latest 15 weeks data
- Subscribe to RSS Feed
- Mark Topic as New
- Mark Topic as Read
- Float this Topic for Current User
- Bookmark
- Subscribe
- Mute
- Printer Friendly Page
- Mark as New
- Bookmark
- Subscribe
- Mute
- Subscribe to RSS Feed
- Permalink
- Report Inappropriate Content
Show latest 15 weeks data
Hi All,
I have my data as below
| Year | Week | Sales |
| 2015 | 34 | 220 |
| 2015 | 35 | 221 |
| 2015 | 36 | 222 |
| 2015 | 37 | 223 |
| 2015 | 38 | 224 |
| 2016 | 1 | 225 |
| 2016 | 26 | 226 |
| 2016 | 27 | 227 |
| 2016 | 45 | 228 |
| 2016 | 46 | 229 |
| 2016 | 47 | 230 |
| 2017 | 1 | 230 |
| 2017 | 2 | 230 |
| 2017 | 3 | 230 |
Now in my bar chart i have to show only latest 10 weeks data .Irrespective of the year .so that i shud get the below data in my charts
| 2015 | 38 | 224 |
| 2016 | 1 | 225 |
| 2016 | 26 | 226 |
| 2016 | 27 | 227 |
| 2016 | 45 | 228 |
| 2016 | 46 | 229 |
| 2016 | 47 | 230 |
| 2017 | 1 | 230 |
| 2017 | 2 | 230 |
| 2017 | 3 | 230 |
How can i achieve this?
- Mark as New
- Bookmark
- Subscribe
- Mute
- Subscribe to RSS Feed
- Permalink
- Report Inappropriate Content
May be like in attached sample.
- Mark as New
- Bookmark
- Subscribe
- Mute
- Subscribe to RSS Feed
- Permalink
- Report Inappropriate Content
Hi,
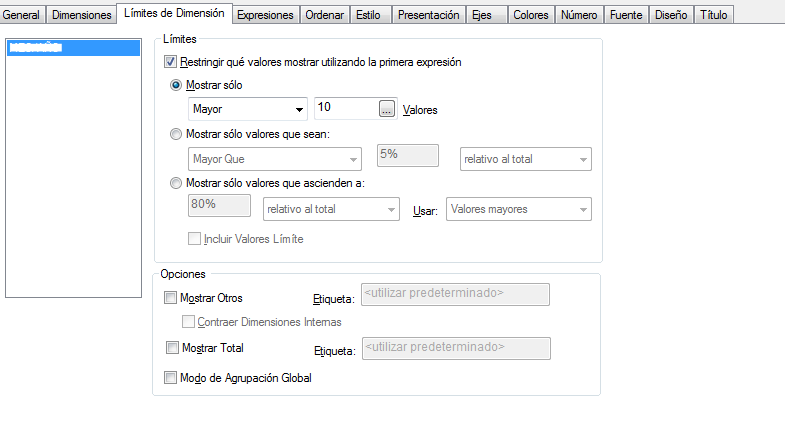
1. You must go to the dimension limit's tab and in the limit area check the check box, in which you can read somethin like: Restringe what values to show.
2. Select the first option in the radio button, and select the 10 higher values
3. It's important (or not) that you deselect the Option area check box, even what are you looking for.
The result looks like this:
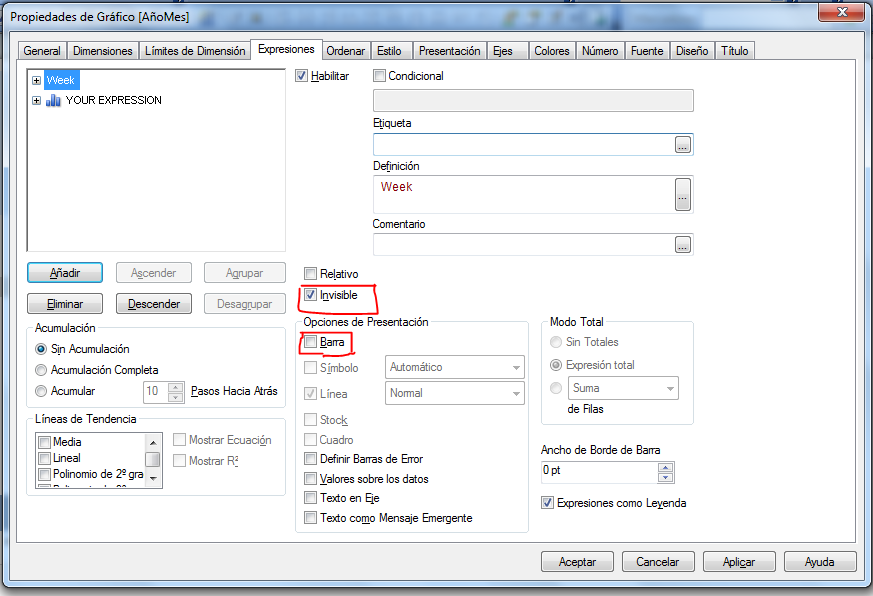
4. Now you must go to the Expressions tab
5. Create a new Expression with your week field. It's important that you order this expression the first, and then you make it invisible to don't see the result. Additionally you can deselect the check box in the options of representation area.
The tab will be like:
Regards.
Enrique Mora.
- Mark as New
- Bookmark
- Subscribe
- Mute
- Subscribe to RSS Feed
- Permalink
- Report Inappropriate Content
Yea..But i have to display as a bar chart.
- Mark as New
- Bookmark
- Subscribe
- Mute
- Subscribe to RSS Feed
- Permalink
- Report Inappropriate Content
So then, create a 2nd expression with the value that you wanted to examine, like you do it when create a normal bar chart
Enrique Mora.