Unlock a world of possibilities! Login now and discover the exclusive benefits awaiting you.
- Qlik Community
- :
- All Forums
- :
- QlikView App Dev
- :
- Show min and max date for individual project
- Subscribe to RSS Feed
- Mark Topic as New
- Mark Topic as Read
- Float this Topic for Current User
- Bookmark
- Subscribe
- Mute
- Printer Friendly Page
- Mark as New
- Bookmark
- Subscribe
- Mute
- Subscribe to RSS Feed
- Permalink
- Report Inappropriate Content
Show min and max date for individual project
Hello community,
I have projects that have start (SOP) and end dates (EOP) - in a bar chart how can I write the Label Expression so that each project is shown with it's own start and end date when hovering over it?
At the moment I have: =Min(Date(SOP)) &' - ' & Max(Date(EOP)) which doesn't lookup the dates for each individual project but shows the overall min and max dates.
I can't get the set analysis right.
Thank you.
Accepted Solutions
- Mark as New
- Bookmark
- Subscribe
- Mute
- Subscribe to RSS Feed
- Permalink
- Report Inappropriate Content
Enclosed.
- Mark as New
- Bookmark
- Subscribe
- Mute
- Subscribe to RSS Feed
- Permalink
- Report Inappropriate Content
Please check enclosed file.This will give you idea...
- Mark as New
- Bookmark
- Subscribe
- Mute
- Subscribe to RSS Feed
- Permalink
- Report Inappropriate Content
thanks for the sample Manish.
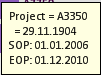
Almost perfect. How can I get rid of the =29.11.1904 which I believe comes from the Definition of the Expression: =Max(Date(EOP))-Min(Date(SOP)) - I put a blank in the Label but it didn't work.
I have everything unchecked in the Display Options (Besides 'Bar')
- Mark as New
- Bookmark
- Subscribe
- Mute
- Subscribe to RSS Feed
- Permalink
- Report Inappropriate Content
Like This ?
- Mark as New
- Bookmark
- Subscribe
- Mute
- Subscribe to RSS Feed
- Permalink
- Report Inappropriate Content
Have you tried as per my 2nd reply?
- Mark as New
- Bookmark
- Subscribe
- Mute
- Subscribe to RSS Feed
- Permalink
- Report Inappropriate Content
Hello Manish,
sorry for the delay.
I should add that I've built a gantt-chart using the "Bar-Offset" property but I don't see why this shouldn't work.
I copied your expression and changed the Sum(Sales) back to "=Max(Date(EOP))-Min(Date(SOP))"
but without luck.
Attached you'll find a little sample with what I have.
- Mark as New
- Bookmark
- Subscribe
- Mute
- Subscribe to RSS Feed
- Permalink
- Report Inappropriate Content
In expression
For Label >> untick values on data points
For INFO >> Tick Values of data points
- Mark as New
- Bookmark
- Subscribe
- Mute
- Subscribe to RSS Feed
- Permalink
- Report Inappropriate Content
but now I have the dates as a label instead of the project but I need it the other way around -> project name right of the bar and then both dates when hovering over one bar.
- Mark as New
- Bookmark
- Subscribe
- Mute
- Subscribe to RSS Feed
- Permalink
- Report Inappropriate Content
Enclosed.
- Mark as New
- Bookmark
- Subscribe
- Mute
- Subscribe to RSS Feed
- Permalink
- Report Inappropriate Content
Perfect! Thank you very much.