Unlock a world of possibilities! Login now and discover the exclusive benefits awaiting you.
- Qlik Community
- :
- All Forums
- :
- QlikView App Dev
- :
- Re: Show the top 10 of the smallest values in a pi...
- Subscribe to RSS Feed
- Mark Topic as New
- Mark Topic as Read
- Float this Topic for Current User
- Bookmark
- Subscribe
- Mute
- Printer Friendly Page
- Mark as New
- Bookmark
- Subscribe
- Mute
- Subscribe to RSS Feed
- Permalink
- Report Inappropriate Content
Show the top 10 of the smallest values in a pivot table
Hi guys,
I would like to know how to display only the top 10 of the lowest values that my expression throws.
But even with this option does not allow me, is there any way I can show what is requested? if you have any examples that could give me would be of great help.
Thank you so much.
Accepted Solutions
- Mark as New
- Bookmark
- Subscribe
- Mute
- Subscribe to RSS Feed
- Permalink
- Report Inappropriate Content
- Mark as New
- Bookmark
- Subscribe
- Mute
- Subscribe to RSS Feed
- Permalink
- Report Inappropriate Content
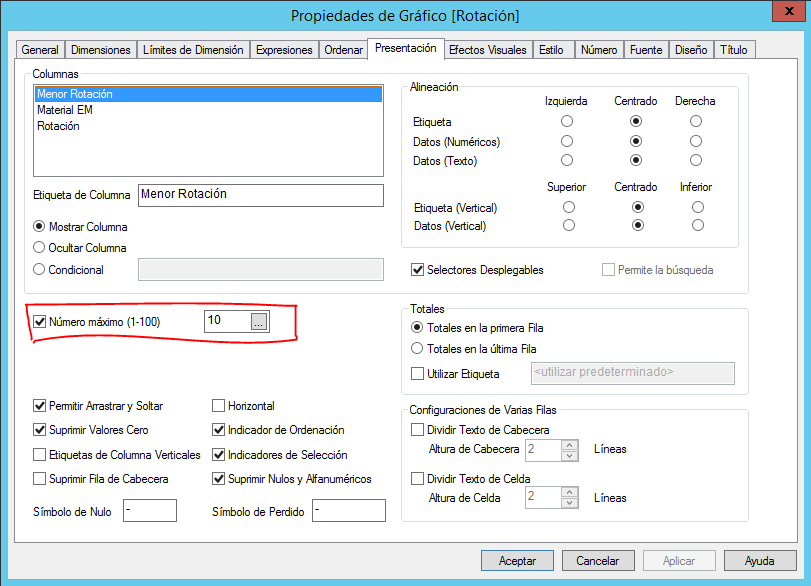
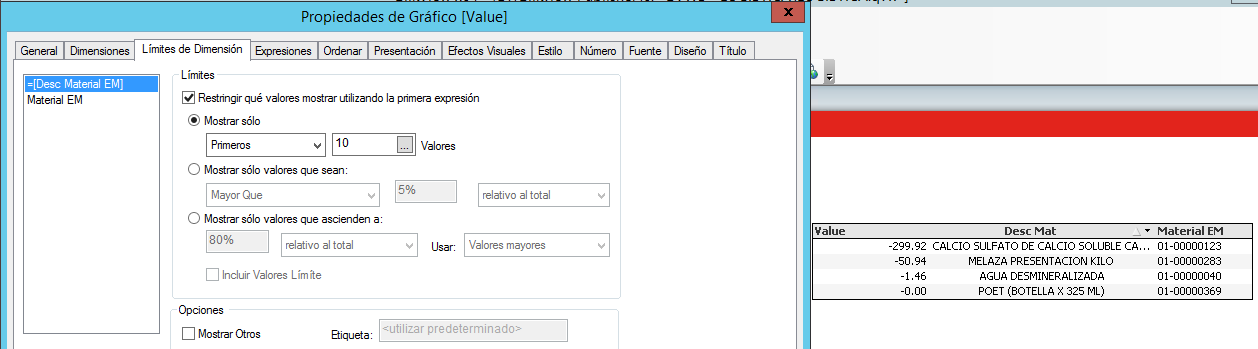
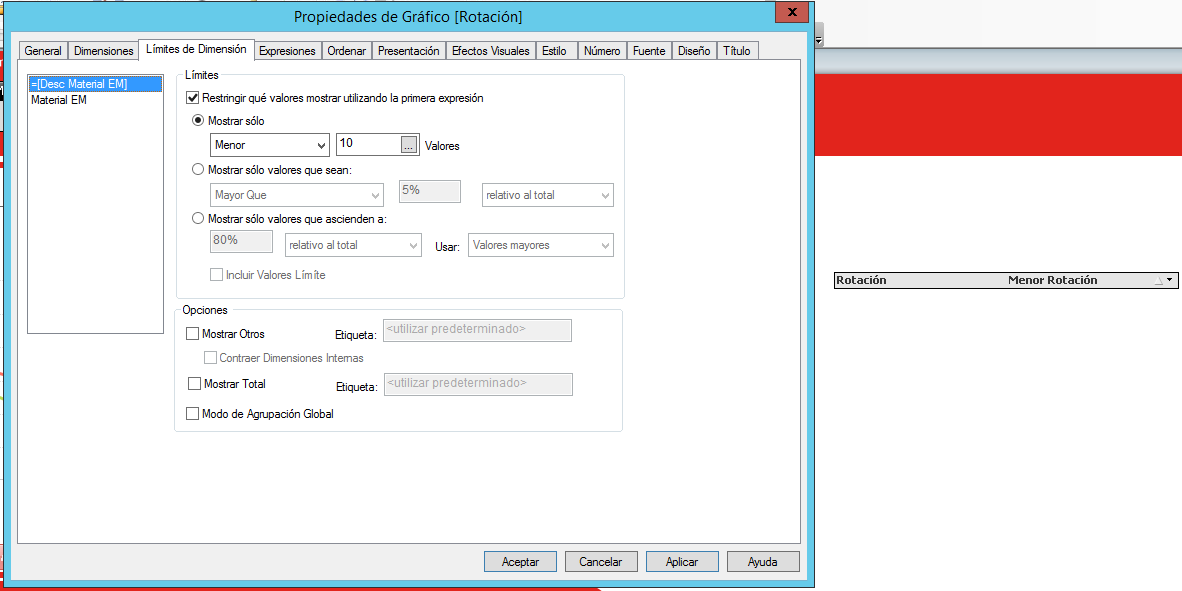
Hi In Dimension Limits->Select :
show only: smallest
Values: 10
In Sort Tab:
Expression: Give your expression
- Mark as New
- Bookmark
- Subscribe
- Mute
- Subscribe to RSS Feed
- Permalink
- Report Inappropriate Content
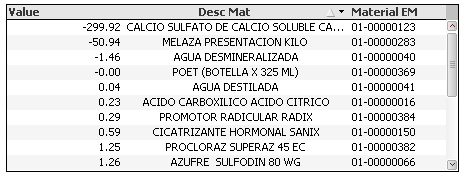
Hi Sasi,
I already did the indicated thing but it does not show me any record.
And my expression is:
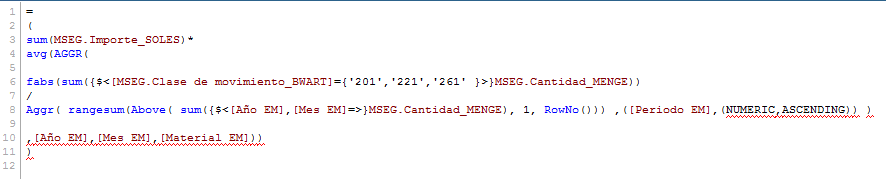
=sum(MSEG.Importe_SOLES)*
avg(AGGR(
fabs(sum({$<[MSEG.Clase de movimiento_BWART]={'201','221','261' }>}MSEG.Cantidad_MENGE))
/
Aggr( rangesum(Above( sum({$<[Año EM],[Mes EM]=>}MSEG.Cantidad_MENGE), 1, RowNo())) ,([Periodo EM],(NUMERIC,ASCENDING)) )
,[Año EM],[Mes EM],[Material EM]))
Thank you so much.
- Mark as New
- Bookmark
- Subscribe
- Mute
- Subscribe to RSS Feed
- Permalink
- Report Inappropriate Content
Thanks so much to everyone I found the solution: