Unlock a world of possibilities! Login now and discover the exclusive benefits awaiting you.
- Qlik Community
- :
- All Forums
- :
- QlikView App Dev
- :
- Show unique values in chart
- Subscribe to RSS Feed
- Mark Topic as New
- Mark Topic as Read
- Float this Topic for Current User
- Bookmark
- Subscribe
- Mute
- Printer Friendly Page
- Mark as New
- Bookmark
- Subscribe
- Mute
- Subscribe to RSS Feed
- Permalink
- Report Inappropriate Content
Show unique values in chart
Hi,
I´m new to Qlikview and are trying to learn the hard way. Now I have a beautiful report that has an error that I am trying to get rid of.
I have a couple of tables linked together with persons and their applications. I would like a chart of their ages, but everyone that has made an application to two or more courses are beeing duplicated in my chart.
Can I make group selection in charts?
My expression in the chart now looks like this
Count (ALDER)
I would like to group that one on distinct PERS_NR
Thank you in advance
Olof
- « Previous Replies
-
- 1
- 2
- Next Replies »
Accepted Solutions
- Mark as New
- Bookmark
- Subscribe
- Mute
- Subscribe to RSS Feed
- Permalink
- Report Inappropriate Content
Hi, please copy and paste again, there was a small mistake
=count({$<ALDER = {'*'}>} distinct PERS_NR)
- Mark as New
- Bookmark
- Subscribe
- Mute
- Subscribe to RSS Feed
- Permalink
- Report Inappropriate Content
Hi Olof,
you'll need to explain a bit more - describe the main tables and fields in your data and describe your Chart (all dimensions and expressions). Ideally, post a small sample.
cheers,
Oleg Troyansky
www.masterssummit.com - take your QlikView skills to the next level!
- Mark as New
- Bookmark
- Subscribe
- Mute
- Subscribe to RSS Feed
- Permalink
- Report Inappropriate Content
If you take "PERS_NR" as dimension, it will be the distinct values in a chart.
HTH Peter
- Mark as New
- Bookmark
- Subscribe
- Mute
- Subscribe to RSS Feed
- Permalink
- Report Inappropriate Content
Thank you for your reply.
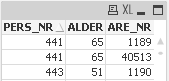
The part I want to make my chart of looks like this. PERS_NR is unique to each person, ALDER is age, ARE_NR is their application number, where the same person can have multiple application which results in duplicates in the chart.
- Mark as New
- Bookmark
- Subscribe
- Mute
- Subscribe to RSS Feed
- Permalink
- Report Inappropriate Content
Thank you for the reply.
Now I have ALDER as a dimension and count(ALDER) as expression. If I add PERS_NR as dimension I get a very strange chart. Even if I change ALDER to PERS_NR as expression my chart goes crazy.
- Mark as New
- Bookmark
- Subscribe
- Mute
- Subscribe to RSS Feed
- Permalink
- Report Inappropriate Content
Hi Olaf,
can you post your chart for better understanding?
BR
Michael
- Mark as New
- Bookmark
- Subscribe
- Mute
- Subscribe to RSS Feed
- Permalink
- Report Inappropriate Content
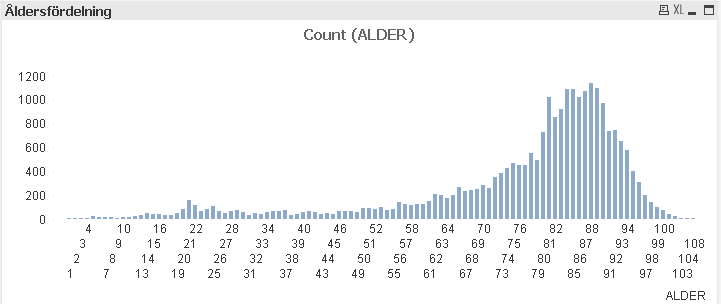
It looks correct until I double check the data and double values appear.
I have also discovered that some people have applied several times so they are listed with different ages. I want to only show the highest age.
- Mark as New
- Bookmark
- Subscribe
- Mute
- Subscribe to RSS Feed
- Permalink
- Report Inappropriate Content
Hi,
above you writing "but everyone that has made an application to two or more courses are beeing duplicated in my Chart", do you use in your Count formula "distinct"? It will Count each PERS_NR only one tme, doesn't matter how often the Person made an application.
BR
Michael
- Mark as New
- Bookmark
- Subscribe
- Mute
- Subscribe to RSS Feed
- Permalink
- Report Inappropriate Content
Thank you for your patience.
I have tried DISTINCT, but it results in the value 1 on every age.
- Mark as New
- Bookmark
- Subscribe
- Mute
- Subscribe to RSS Feed
- Permalink
- Report Inappropriate Content
Count ( DISTINCT ALDER)
- « Previous Replies
-
- 1
- 2
- Next Replies »