Unlock a world of possibilities! Login now and discover the exclusive benefits awaiting you.
- Qlik Community
- :
- All Forums
- :
- QlikView App Dev
- :
- Re: Showing Specific Dates on a Line Chart with Co...
- Subscribe to RSS Feed
- Mark Topic as New
- Mark Topic as Read
- Float this Topic for Current User
- Bookmark
- Subscribe
- Mute
- Printer Friendly Page
- Mark as New
- Bookmark
- Subscribe
- Mute
- Subscribe to RSS Feed
- Permalink
- Report Inappropriate Content
Showing Specific Dates on a Line Chart with Continuous Axis
I have a chart where I want a data point for every day of the year and have all data points be visible without scrolling. I know I'm supposed to check the box for continuous in the Axis tab, but when I do this, the chart shows the label for the first day of each month.
How can I get it to show the label for the last day of the month (while still plotting the points for all days in between)?
- « Previous Replies
-
- 1
- 2
- Next Replies »
- Mark as New
- Bookmark
- Subscribe
- Mute
- Subscribe to RSS Feed
- Permalink
- Report Inappropriate Content
That is not what I'm looking for. If you notice in your chart, you're missing all of the data points in between the visible dates. Below is what I'm able to get. Except I want the label to be for the last date of the month, not the first.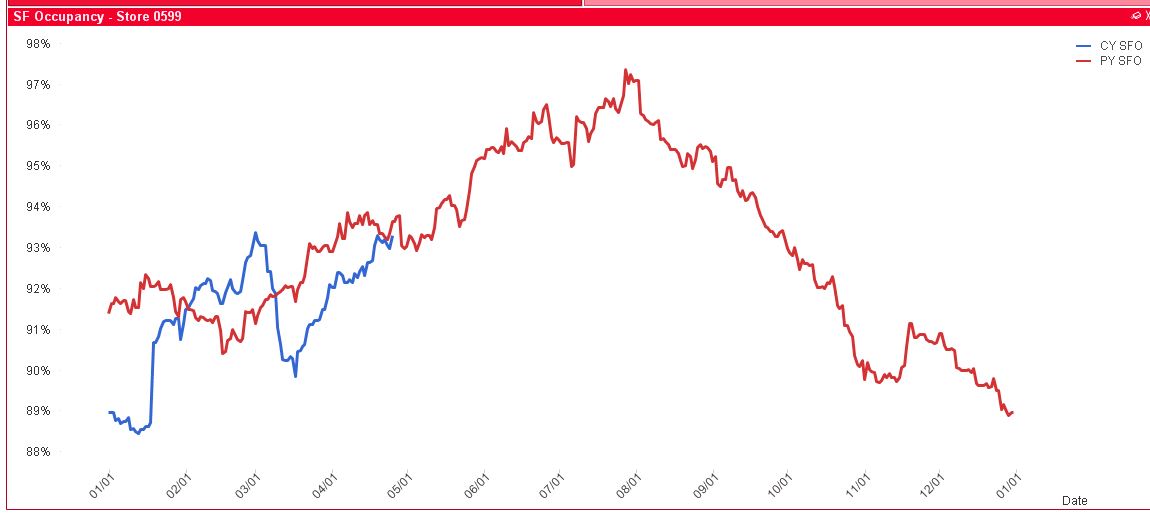
- Mark as New
- Bookmark
- Subscribe
- Mute
- Subscribe to RSS Feed
- Permalink
- Report Inappropriate Content
- Mark as New
- Bookmark
- Subscribe
- Mute
- Subscribe to RSS Feed
- Permalink
- Report Inappropriate Content
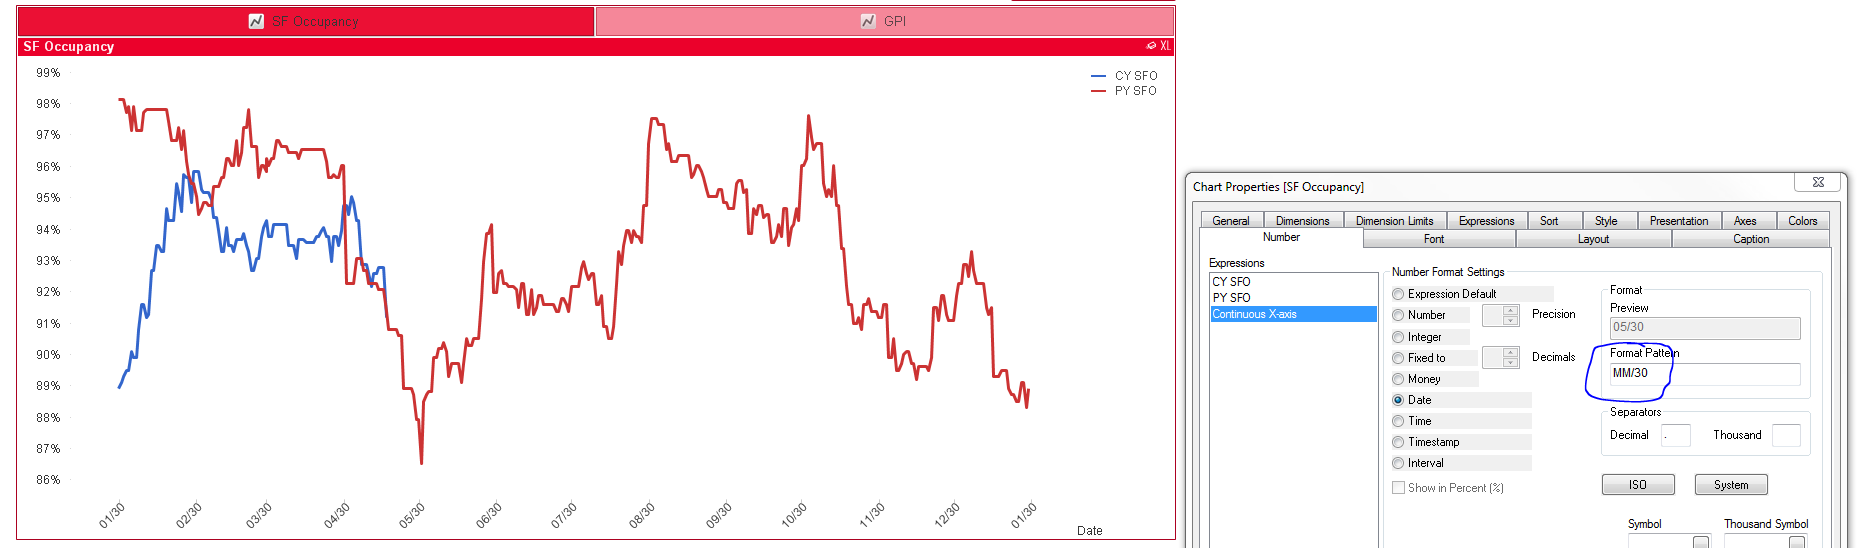
May not be the best option, but this is the most I was able to figure out
- Mark as New
- Bookmark
- Subscribe
- Mute
- Subscribe to RSS Feed
- Permalink
- Report Inappropriate Content
That wouldn't work at all. It just changes all of the date labels to MM/30. So if I filtered down to a single month, it shows 1/30 1/30 1/30 over and over instead of 1/1 1/2 1/3.
- Mark as New
- Bookmark
- Subscribe
- Mute
- Subscribe to RSS Feed
- Permalink
- Report Inappropriate Content
Yup don't know of a way to do this...
- « Previous Replies
-
- 1
- 2
- Next Replies »