Unlock a world of possibilities! Login now and discover the exclusive benefits awaiting you.
- Qlik Community
- :
- All Forums
- :
- QlikView App Dev
- :
- Re: Shw
- Subscribe to RSS Feed
- Mark Topic as New
- Mark Topic as Read
- Float this Topic for Current User
- Bookmark
- Subscribe
- Mute
- Printer Friendly Page
- Mark as New
- Bookmark
- Subscribe
- Mute
- Subscribe to RSS Feed
- Permalink
- Report Inappropriate Content
Shw
Hi,
I have many data tables in below-mentioned tables (here I only showed two tables for example). Table1 consist of Production & recovery data and table2 consist of Sales data. Now My requirement is to show the data in Row-wise format as per below mentioned desired outputs. Output can be only dimension wise (as per output1) or It can be Plant or material wise (as per output2).
Kindly suggest how can I get the desired output.
| Table1 | Table2 | ||||||
| Plant | Material | Production | Recovery | Plant | Material | Sales | |
| 1001 | 10001 | 10 | 20 | 1001 | 10001 | 10 | |
| 1002 | 10001 | 20 | 30 | 1002 | 10001 | 20 | |
| 1003 | 10001 | 30 | 40 | 1003 | 10001 | 30 | |
| 1001 | 10002 | 40 | 10 | 1001 | 10002 | 40 | |
| 1002 | 10002 | 50 | 30 | 1002 | 10002 | 50 | |
| 1003 | 10002 | 60 | 40 | 1003 | 10002 | 60 | |
| 1001 | 10003 | 70 | 40 | 1001 | 10003 | 70 | |
| 1002 | 10003 | 80 | 30 | 1002 | 10003 | 80 | |
| 1003 | 10003 | 90 | 40 | 1003 | 10003 | 90 | |
| Output1 | |
| Sales | 450 |
| Production | 450 |
| Recovery | 280 |
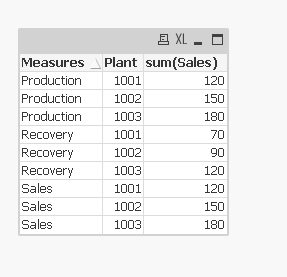
Output2 | ||
| Dimension | Plant | Total |
| Sales | 1001 | 120 |
| Sales | 1002 | 150 |
| Sales | 1003 | 180 |
| Production | 1001 | 120 |
| Production | 1002 | 150 |
| Production | 1003 | 180 |
| Recovery | 1001 | 70 |
| Recovery | 1002 | 90 |
| Recovery | 1003 | 120 |
- « Previous Replies
-
- 1
- 2
- Next Replies »
- Mark as New
- Bookmark
- Subscribe
- Mute
- Subscribe to RSS Feed
- Permalink
- Report Inappropriate Content
Hi,
Use following script for your required output:
Table1:
load * Inline
[Plant,Material,Production,Recovery,
1001,10001,10,20
1002,10001,20,30
1003,10001,30,40
1001,10002,40,10
1002,10002,50,30
1003,10002,60,40
1001,10003,70,40
1002,10003,80,30
1003,10003,90,40
];
Table2:
LOAD * Inline
[Plant,Material,Sales
1001,10001,10
1002,10001,20
1003,10001,30
1001,10002,40
1002,10002,50
1003,10002,60
1001,10003,70
1002,10003,80
1003,10003,90
];
Sal:
load Plant, sum(Sales) as Total_Sales Resident Table2 Group by Plant;
output_data :
load 'Sales' as Dimension ,Plant,Total_Sales as Total Resident Sal;
drop table Sal;
production_d:
load Plant,sum(Production) as Total_Prodution Resident Table1 Group by Plant;
load 'Production' as Dimension,Plant,Total_Prodution as Total Resident production_d;
drop table production_d;
Recovery_d:
load Plant,sum(Recovery) as Total_Recovery Resident Table1 Group by Plant;
load 'Recovery' as Dimension,Plant,Total_Recovery as Total Resident Recovery_d;
drop table Recovery_d;
drop tables Table1,Table2;

- Mark as New
- Bookmark
- Subscribe
- Mute
- Subscribe to RSS Feed
- Permalink
- Report Inappropriate Content
If you need OUTPUT then add following line at the end of above script:
Ouput1:
load Dimension, sum(Total) as Output1_Total Resident output_data Group by Dimension ;
- Mark as New
- Bookmark
- Subscribe
- Mute
- Subscribe to RSS Feed
- Permalink
- Report Inappropriate Content
Thanks, Arvind for your valuable time, I don't wanna use sum or group by functions. Because I have already mentioned that these 2 tables are the only example and every table consist of more than 10 dimensions. I have more than 20 transactions like the above example tables. I want to show the data on the front end.
Kindly suggest query for the front end to show the data.
- Mark as New
- Bookmark
- Subscribe
- Mute
- Subscribe to RSS Feed
- Permalink
- Report Inappropriate Content
THEN IT IS VERY SIMPLE USE PICK MATCH FUNCTIONS IN CHART
- Mark as New
- Bookmark
- Subscribe
- Mute
- Subscribe to RSS Feed
- Permalink
- Report Inappropriate Content
Did you mean I have to user Pick Match in expression?
Can you please suggest how to use?
- Mark as New
- Bookmark
- Subscribe
- Mute
- Subscribe to RSS Feed
- Permalink
- Report Inappropriate Content
Hello Rakesh,
Please find .qvw contains solution to give output1.
This can be achieved by using crossTable.
Code:
Table1:
Crosstable (Measures, Sales, 2)
load * Inline
[Plant,Material,Production,Recovery,
1001,10001,10,20
1002,10001,20,30
1003,10001,30,40
1001,10002,40,10
1002,10002,50,30
1003,10002,60,40
1001,10003,70,40
1002,10003,80,30
1003,10003,90,40
];
Table2:
Crosstable (Measures, Sales, 2)
LOAD * Inline
[Plant,Material,Sales
1001,10001,10
1002,10001,20
1003,10001,30
1001,10002,40
1002,10002,50
1003,10002,60
1001,10003,70
1002,10003,80
1003,10003,90
];
c:
LOAD Measures, sum(Sales)
Resident Table1
Group by Measures;
drop Table Table1;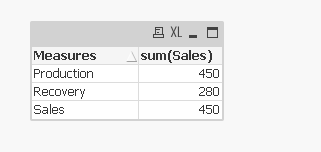
- Mark as New
- Bookmark
- Subscribe
- Mute
- Subscribe to RSS Feed
- Permalink
- Report Inappropriate Content
Here is output2:
- Mark as New
- Bookmark
- Subscribe
- Mute
- Subscribe to RSS Feed
- Permalink
- Report Inappropriate Content
Hi Megha,
Thanks for your time & reply...
But I cannot use crosstable, because I have more than 20 tables like this, which are concatenated. So there I cannot user cross table or group by function.
I just want to show the data in the output format. Kindly suggest any format through the front end.
- Mark as New
- Bookmark
- Subscribe
- Mute
- Subscribe to RSS Feed
- Permalink
- Report Inappropriate Content
Tell me how many distinct values are their in Measue
like Production,Sales,Recovery
- « Previous Replies
-
- 1
- 2
- Next Replies »