Unlock a world of possibilities! Login now and discover the exclusive benefits awaiting you.
- Qlik Community
- :
- All Forums
- :
- QlikView App Dev
- :
- Re: Sort by date and then by time
- Subscribe to RSS Feed
- Mark Topic as New
- Mark Topic as Read
- Float this Topic for Current User
- Bookmark
- Subscribe
- Mute
- Printer Friendly Page
- Mark as New
- Bookmark
- Subscribe
- Mute
- Subscribe to RSS Feed
- Permalink
- Report Inappropriate Content
Sort by date and then by time
Hi everyone,
I am struggling to sort my data in a graph.
What I need:
1. Sort the data by date:
11.11.2017
12.11.2017
13.11.2017
2. In the same day, sort the data by time:
11.11.2017
- 6:12:10
- 7:14:45
- 13:01:01
12.11.2017
- 5:02:02
- 17:02:00
13.11.2017
etc....
Could you please support on this?
thanks
Mat
- « Previous Replies
-
- 1
- 2
- Next Replies »
- Mark as New
- Bookmark
- Subscribe
- Mute
- Subscribe to RSS Feed
- Permalink
- Report Inappropriate Content
Do you need any other information? Script ? Layout of multitable and graph?
- Mark as New
- Bookmark
- Subscribe
- Mute
- Subscribe to RSS Feed
- Permalink
- Report Inappropriate Content
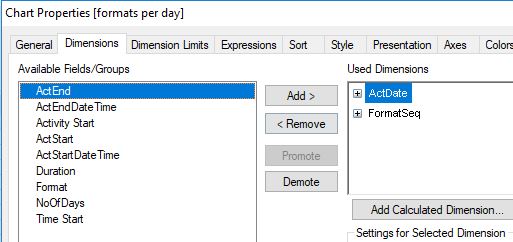
Where does the Format dimension come from?
- Mark as New
- Bookmark
- Subscribe
- Mute
- Subscribe to RSS Feed
- Permalink
- Report Inappropriate Content
The format comes from a second sheet, a simple link between material number (key) and format (see file attached).
The idea is quite simple:
1. Sort the material number by date (activity start)
2. For each date, sort the material by time (time start) which consist of starting time of machines (ressources)
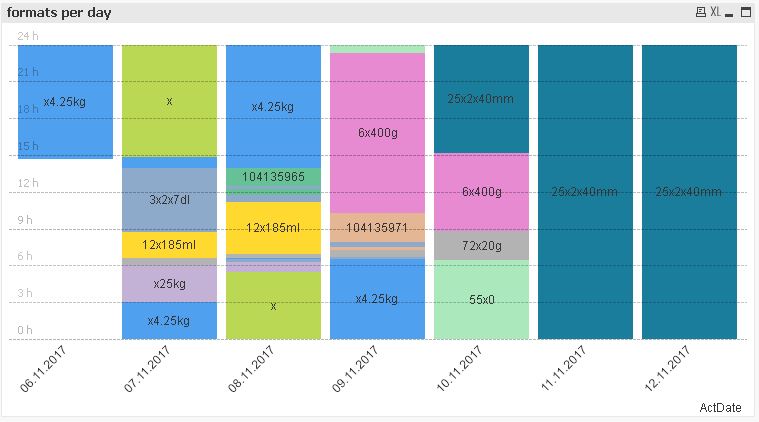
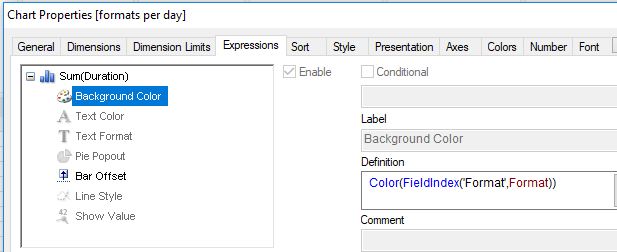
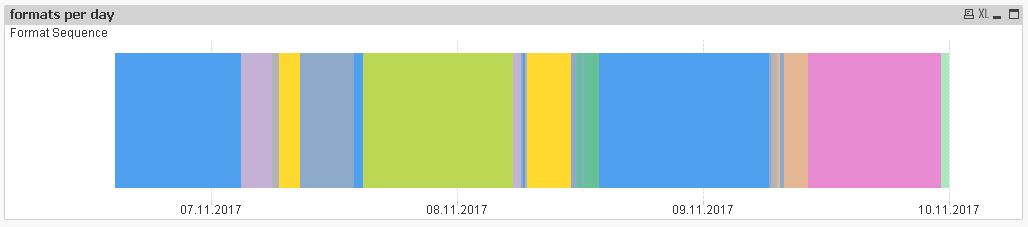
3. once the sorting is correct, the graph with colors link the material number (key) with the format. For each format you have a different colors, it gives a good visual overview of material changes on the production line.
But to see the right order, I need to sort it by date and time...
thanks for the support
Mat
- Mark as New
- Bookmark
- Subscribe
- Mute
- Subscribe to RSS Feed
- Permalink
- Report Inappropriate Content
Hi,
maybe one solution might be:
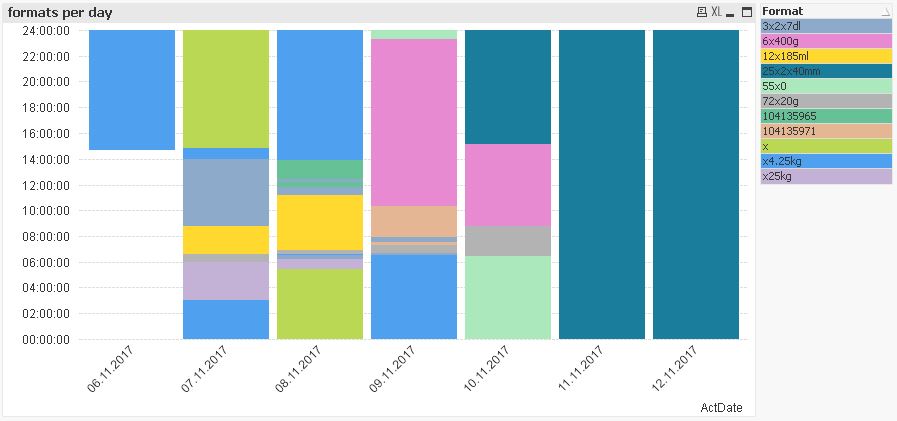
or using a horizontal bar chart:
mapFormat:
Mapping
LOAD Material,
    Text(Format)
FROM [https://community.qlik.com/servlet/JiveServlet/download/1379667-303338/Formate.xlsx] (ooxml, embedded labels, table is Sheet2);

tabTemp:
LOAD *,
    Timestamp([Activity Start]+[Time Start]) as ActStartDateTime;
LOAD Date#([Activity Start],'DD.MM.YYYY') as [Activity Start],
    [Time Start],
    Text(ApplyMap('mapFormat',Material)) as Format
FROM [https://community.qlik.com/servlet/JiveServlet/download/1378480-303098/example%20qlikview.xlsx] (ooxml, embedded labels, table is [Plan KW+3])
Where [Activity Start];

tabTemp2:
LOAD *,
    RowNo() as FormatSeq
Resident tabTemp
Where Format<>Previous(Format)
Order By ActStartDateTime;

DROP Table tabTemp;

tabResult:
LOAD *,
    DayName(ActStart) as ActDate,
    Interval(ActEnd-ActStart) as Duration;
LOAD *,
    If(IterNo()=1      , ActStartDateTime, DayStart(ActStartDateTime+IterNo()-1)) as ActStart,
    If(IterNo()=NoOfDays, ActEndDateTime  , DayEnd(  ActStartDateTime+IterNo()-1)) as ActEnd
While IterNo()<=NoOfDays;
LOAD *,
    Previous(ActStartDateTime) as ActEndDateTime,
    Floor(Previous(ActStartDateTime))-Floor(ActStartDateTime)+1 as NoOfDays
Resident tabTemp2
Order By FormatSeq desc;

DROP Table tabTemp2;
hope this helps
regards
Marco
- Mark as New
- Bookmark
- Subscribe
- Mute
- Subscribe to RSS Feed
- Permalink
- Report Inappropriate Content
Hi Matt,
I have changed the format of [Activity Start] field to help in sorting of date and time as expected. Please see script attached.
After reloading make sure you sort on [Activity Start] numeric values ascending then in the [Time Start] field numeric values ascending.
Sorting new vs old activity start.png compares how it sorted before and after formatting. I have also tried to recreate the Mekko chart and filtered on the shown formats.
Hope it helps.
Thanks,
Monica
- Mark as New
- Bookmark
- Subscribe
- Mute
- Subscribe to RSS Feed
- Permalink
- Report Inappropriate Content
Hi
thanks for your help, unfortunately changing the format of dates doesn't help much.
take this example:
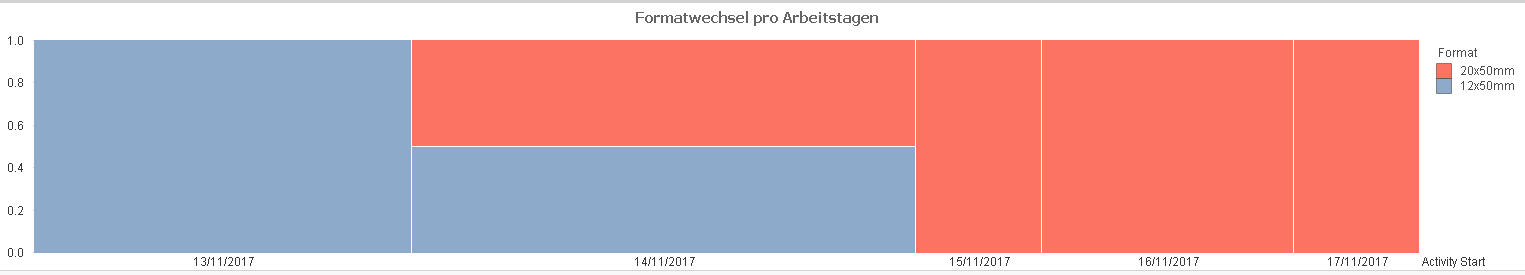
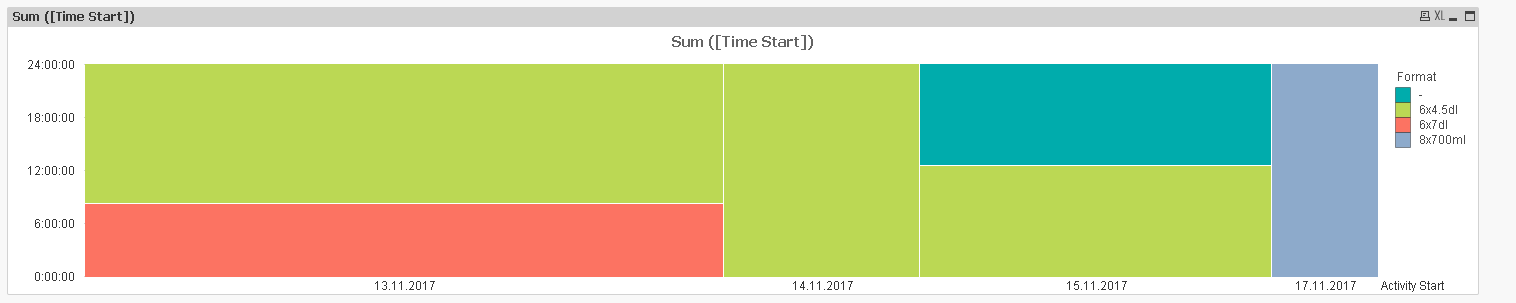
graph overview: If correct, the "red part" should be under the "blue" part on date 14/11/2017
- morning top of the graph
- evening down
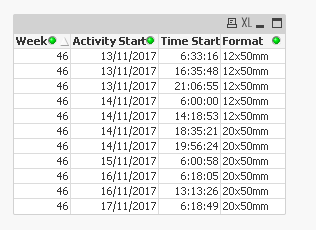
data:
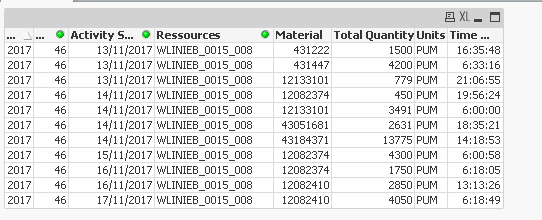
Format:
- Mark as New
- Bookmark
- Subscribe
- Mute
- Subscribe to RSS Feed
- Permalink
- Report Inappropriate Content
Is it maybe simply the axis of the graph that should be managed??? with time???
- Mark as New
- Bookmark
- Subscribe
- Mute
- Subscribe to RSS Feed
- Permalink
- Report Inappropriate Content
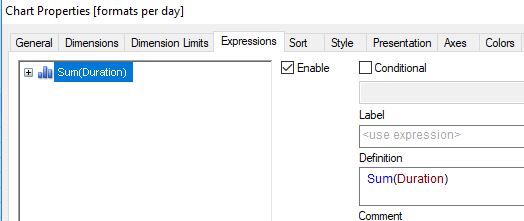
or maybe simply the graph properties?
- Mark as New
- Bookmark
- Subscribe
- Mute
- Subscribe to RSS Feed
- Permalink
- Report Inappropriate Content
Maybe I could test that: Do you know how to change the axis on the left of the graph so that the time goes from 00:00:00 on the top to 24:00:00 on the bottom??
the contrary as on the image below
- « Previous Replies
-
- 1
- 2
- Next Replies »