Unlock a world of possibilities! Login now and discover the exclusive benefits awaiting you.
- Qlik Community
- :
- All Forums
- :
- QlikView App Dev
- :
- Re: Stacked Chart with Line Chart
- Subscribe to RSS Feed
- Mark Topic as New
- Mark Topic as Read
- Float this Topic for Current User
- Bookmark
- Subscribe
- Mute
- Printer Friendly Page
- Mark as New
- Bookmark
- Subscribe
- Mute
- Subscribe to RSS Feed
- Permalink
- Report Inappropriate Content
Stacked Chart with Line Chart
Hello,
I would like to stack three variables in a bar chart and then have a fourth variable as a line graph. I would also like this to be part of a cyclic group. Only one of the three variables in the stacked has a relationship with the fourth (line graph).
At the moment, I have "=$(=only(__DateVarianceField))" as the only dimension and this allows me to see the three variables versus date as a bar graph. I have attempted to add the fourth variable as an expression however this seems not to work. Any ideas please?
Thanks,
- Mark as New
- Bookmark
- Subscribe
- Mute
- Subscribe to RSS Feed
- Permalink
- Report Inappropriate Content
Can you upload a copy of the application
- Mark as New
- Bookmark
- Subscribe
- Mute
- Subscribe to RSS Feed
- Permalink
- Report Inappropriate Content
I could send it to an email address if you can send me one?
It's about 52KB in size.
- Mark as New
- Bookmark
- Subscribe
- Mute
- Subscribe to RSS Feed
- Permalink
- Report Inappropriate Content
- Mark as New
- Bookmark
- Subscribe
- Mute
- Subscribe to RSS Feed
- Permalink
- Report Inappropriate Content
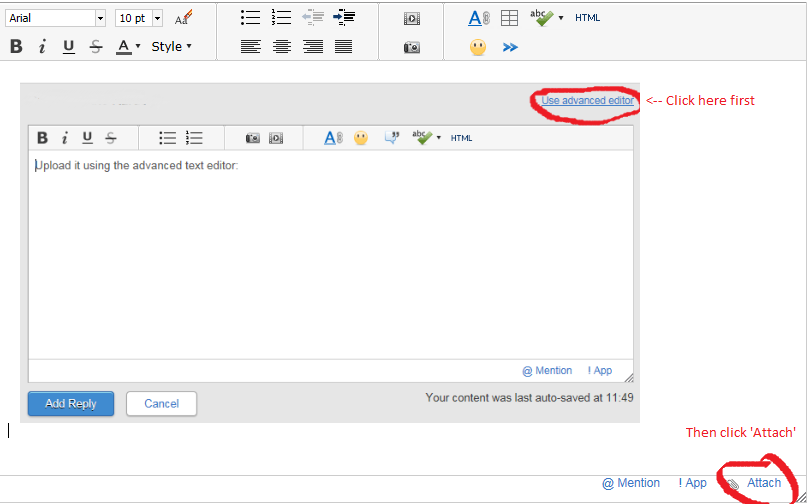
I do not appear to have the option to 'use advanced editor'
- Mark as New
- Bookmark
- Subscribe
- Mute
- Subscribe to RSS Feed
- Permalink
- Report Inappropriate Content
Hi Mike,
You have to be in the actual blog post not from your inbox!
Click on the blog title to ensure you are redirected to the original blog!