Unlock a world of possibilities! Login now and discover the exclusive benefits awaiting you.
- Qlik Community
- :
- All Forums
- :
- QlikView App Dev
- :
- Stacked chart
- Subscribe to RSS Feed
- Mark Topic as New
- Mark Topic as Read
- Float this Topic for Current User
- Bookmark
- Subscribe
- Mute
- Printer Friendly Page
- Mark as New
- Bookmark
- Subscribe
- Mute
- Subscribe to RSS Feed
- Permalink
- Report Inappropriate Content
Stacked chart
Hi,
I had a question regarding stacked bar chart.
I have attcahed a sample excel and a pic of the required stacked bar chart.
Can someone help me here?
I want x axis to have sum of subjects as well as names of students for each subject .
Y axis should have number of days
Stacked chart should represent number of days for that particular student under a particular subject. The colors on each stack represents the dept wise sum of days.
Accepted Solutions
- Mark as New
- Bookmark
- Subscribe
- Mute
- Subscribe to RSS Feed
- Permalink
- Report Inappropriate Content
Hi,
one solution could be:
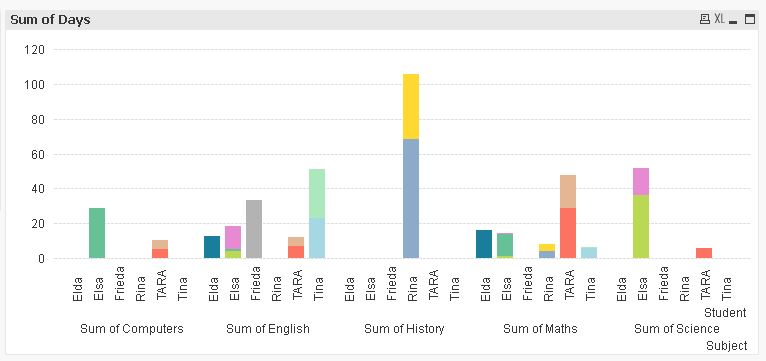
table1:
CrossTable(DeptTemp, Days, 2)
LOAD Values as Subject,
    Dept as Student,
    [553.000000],
    [718.000000],
    [778.000000],
    [793.000000],
    [819.000000],
    [820.000000],
    [838.000000],
    [894.000000],
    [895.000000],
    [919.000000],
    [920.000000],
    [923.000000]
FROM [https://community.qlik.com/servlet/JiveServlet/download/965012-208942/Stacked.xlsx] (ooxml, embedded labels, table is Sheet1, filters(Replace(1, top, StrCnd(null))));

Left Join (table1)
LOAD Distinct
    DeptTemp,
    Num(Num#(DeptTemp)) as Dept
Resident table1;

DROP Field DeptTemp;
hope this helps
regards
Marco
- Mark as New
- Bookmark
- Subscribe
- Mute
- Subscribe to RSS Feed
- Permalink
- Report Inappropriate Content
Like this one:
- Mark as New
- Bookmark
- Subscribe
- Mute
- Subscribe to RSS Feed
- Permalink
- Report Inappropriate Content
Hi,
one solution could be:
table1:
CrossTable(DeptTemp, Days, 2)
LOAD Values as Subject,
    Dept as Student,
    [553.000000],
    [718.000000],
    [778.000000],
    [793.000000],
    [819.000000],
    [820.000000],
    [838.000000],
    [894.000000],
    [895.000000],
    [919.000000],
    [920.000000],
    [923.000000]
FROM [https://community.qlik.com/servlet/JiveServlet/download/965012-208942/Stacked.xlsx] (ooxml, embedded labels, table is Sheet1, filters(Replace(1, top, StrCnd(null))));

Left Join (table1)
LOAD Distinct
    DeptTemp,
    Num(Num#(DeptTemp)) as Dept
Resident table1;

DROP Field DeptTemp;
hope this helps
regards
Marco
- Mark as New
- Bookmark
- Subscribe
- Mute
- Subscribe to RSS Feed
- Permalink
- Report Inappropriate Content
Thanks Marco...
I had one more question.. I have updated the image in the pic.docx . Below "Updated new" and in 2nd page.
Is it possible to partition the x axis labels like in the image? Any nearest workaround?
- Mark as New
- Bookmark
- Subscribe
- Mute
- Subscribe to RSS Feed
- Permalink
- Report Inappropriate Content
You're welcome.
I don't think those lines like in your sketch can be drawn.
regards
Marco
- Mark as New
- Bookmark
- Subscribe
- Mute
- Subscribe to RSS Feed
- Permalink
- Report Inappropriate Content
oh...any other way to compartmentalize? any workarounds?
- Mark as New
- Bookmark
- Subscribe
- Mute
- Subscribe to RSS Feed
- Permalink
- Report Inappropriate Content
Even if there is a way to compartmentalize for subjects that would be good.
- Mark as New
- Bookmark
- Subscribe
- Mute
- Subscribe to RSS Feed
- Permalink
- Report Inappropriate Content
Hi,
I want to sort the stacked bar chart by their values, ascending or descending.
I see some of the discussion where solutions are for 2 dimensions:
Bar Chart 2 Dimentions sorting
But i am not able to implement it for 3 dimension. Any help is appreciated.
Thanks