Unlock a world of possibilities! Login now and discover the exclusive benefits awaiting you.
- Qlik Community
- :
- All Forums
- :
- QlikView App Dev
- :
- Re: Standard Deviation Bell Chart
- Subscribe to RSS Feed
- Mark Topic as New
- Mark Topic as Read
- Float this Topic for Current User
- Bookmark
- Subscribe
- Mute
- Printer Friendly Page
- Mark as New
- Bookmark
- Subscribe
- Mute
- Subscribe to RSS Feed
- Permalink
- Report Inappropriate Content
Standard Deviation Bell Chart
Hello colleagues
I need some help to build and understand how to get nice "Bell curve" for my Answers data (please see at attachments).
For initial version I've used a recipe from Henric.
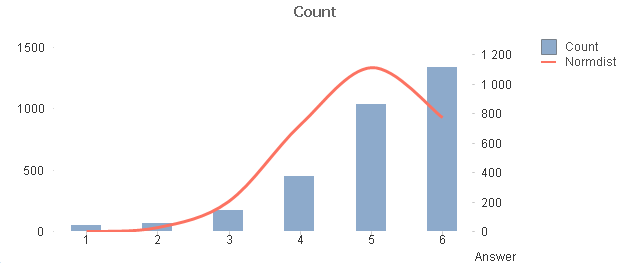
But the picture is not what I expected:
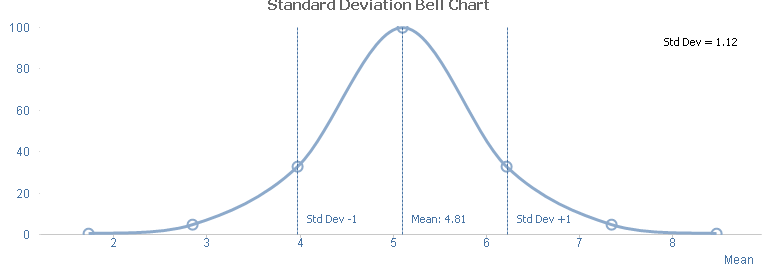
I need to have something like this:
Could someone explain me what should I do and where I was wrong in my current approach.
Might be I need to use another function (not the Normdist() )
Thanks a lot.
- Mark as New
- Bookmark
- Subscribe
- Mute
- Subscribe to RSS Feed
- Permalink
- Report Inappropriate Content
I think you are doing the right thing. Normdist() is the function to use for a bell curve (a.k.a. Gaussian or Normal distribution).
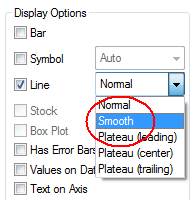
The problem is that your Answer only has 6 distinct values. Hence, the Normdist() is calculated just for these six values - not for the values between. And so the curve will look a little crooked. It will look slightly better if you choose the "smooth" option though (Expressions - to the right of the "Line" check box).
HIC
- Mark as New
- Bookmark
- Subscribe
- Mute
- Subscribe to RSS Feed
- Permalink
- Report Inappropriate Content
Hi Henric
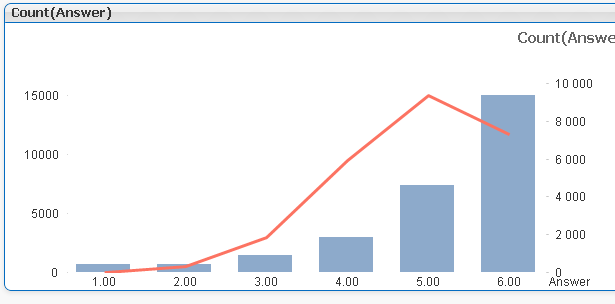
Thanks for the explanation, with smooth it looks more kindly.
As you said, I can't get beautiful bell curve for my answers (1 to 6), so I think about Standard deviation instead of normal (Gaussian) distribution. Some more additional info I found here: Normal Distribution vs Standard deviation
Is it possible in QlikView? Do we have any specific function for it, like normdist() - for normal distribution?
Thanks,
Anatoly
- Mark as New
- Bookmark
- Subscribe
- Mute
- Subscribe to RSS Feed
- Permalink
- Report Inappropriate Content
The standard deviation can be calculated using Stdev(). But it is not what you want here. You want a distribution of values with average and standard deviation as input parameters. Normdist() is probably the best choice.
HIC
- Mark as New
- Bookmark
- Subscribe
- Mute
- Subscribe to RSS Feed
- Permalink
- Report Inappropriate Content
Hello,
What is solution?
- Mark as New
- Bookmark
- Subscribe
- Mute
- Subscribe to RSS Feed
- Permalink
- Report Inappropriate Content
- To use the Normdist() to create the bell curve. (If a bell curve is what you want.) What you should use as input (Mean and StDev) can be discussed though. Calculated from data? Or hard coded to something else?
- To use the "smooth" display option.
HIC