Unlock a world of possibilities! Login now and discover the exclusive benefits awaiting you.
- Qlik Community
- :
- All Forums
- :
- QlikView App Dev
- :
- Re: Straight Table with Two Columns
- Subscribe to RSS Feed
- Mark Topic as New
- Mark Topic as Read
- Float this Topic for Current User
- Bookmark
- Subscribe
- Mute
- Printer Friendly Page
- Mark as New
- Bookmark
- Subscribe
- Mute
- Subscribe to RSS Feed
- Permalink
- Report Inappropriate Content
Straight Table with Two Columns
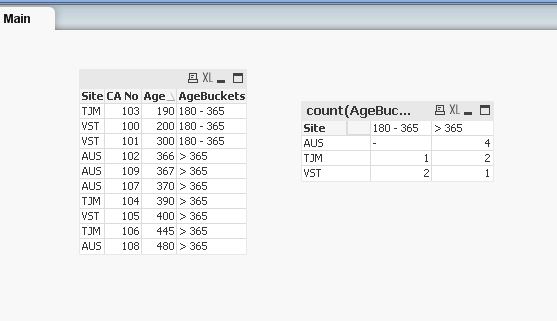
Trying to create a straight table that displays data by Site (per Row) and Age Buckets (Columns) See below:
Site 180 - 365 >365
VST 2 1
TJM 1 2
AUS 0 4
My Data is as follows:
Site CA No Age
VST 100 200
VST 101 300
AUS 102 366
TJM 103 190
TJM 104 390
VST 105 400
TJM 106 445
AUS 107 370
AUS 108 480
AUS 109 367
I am creating the Age Buckets in my dimensions with an if statement (=if([CA No] < 365, '180 - 365', '> 365') along with Site. I can't get the Age Bucket out of the rows and into two columns.
Thanks
Jeff
- Mark as New
- Bookmark
- Subscribe
- Mute
- Subscribe to RSS Feed
- Permalink
- Report Inappropriate Content
PFA
- Mark as New
- Bookmark
- Subscribe
- Mute
- Subscribe to RSS Feed
- Permalink
- Report Inappropriate Content
Hi,
you if condition should be Age instead of "CA No" and the to show the age_bucket calculated column do transformation row-into column using pivot chart object.
Data:
load *,if(Age<365, '180 - 365', '> 365') as AgeBuckets;
LOAD * INLINE [
Site, CA No, Age
VST, 100, 200
VST, 101, 300
AUS, 102, 366
TJM, 103, 190
TJM, 104, 390
VST, 105, 400
TJM, 106, 445
AUS, 107, 370
AUS, 108, 480
AUS, 109, 367
];