Unlock a world of possibilities! Login now and discover the exclusive benefits awaiting you.
- Qlik Community
- :
- All Forums
- :
- QlikView App Dev
- :
- Re: Straight table to only show top 10 values
- Subscribe to RSS Feed
- Mark Topic as New
- Mark Topic as Read
- Float this Topic for Current User
- Bookmark
- Subscribe
- Mute
- Printer Friendly Page
- Mark as New
- Bookmark
- Subscribe
- Mute
- Subscribe to RSS Feed
- Permalink
- Report Inappropriate Content
Straight table to only show top 10 values
I have a straight table and I would like to only show the top 10 oldest issues for a Monthly Load Date. Below is a calculation that I have tried to use to get a count, but I cannot figure out how to use this to get the Rank to show top 10. I have looked around at other posts, but I cannot figure it out, using the Load date as a criteria. Any help would be greatly appreciated.
=count({<[Monthly Unique Issue] ={'0'},[Monthly Unique AP]={'0'},[Monthly Load Date] = {'$(=Max([Monthly Load Date]))'}>} [Monthly Issue ID])
Attached is sample data that I am working with
- « Previous Replies
- Next Replies »
Accepted Solutions
- Mark as New
- Bookmark
- Subscribe
- Mute
- Subscribe to RSS Feed
- Permalink
- Report Inappropriate Content
May be this:
If(Rank(TOTAL Only({<[Monthly Load Date] = {'$(=Max([Monthly Load Date]))'}>} [Monthly Issue Age]), 4) < 11, Only({<[Monthly Load Date] = {'$(=Max([Monthly Load Date]))'}>} [Monthly Issue Age]))
Sample attached
- Mark as New
- Bookmark
- Subscribe
- Mute
- Subscribe to RSS Feed
- Permalink
- Report Inappropriate Content
May be like this:
If(Rank(Count({<[Monthly Unique Issue] ={'0'},[Monthly Unique AP]={'0'},[Monthly Load Date] = {'$(=Max([Monthly Load Date]))'}>} [Monthly Issue ID])) < 11, Count({<[Monthly Unique Issue] ={'0'},[Monthly Unique AP]={'0'},[Monthly Load Date] = {'$(=Max([Monthly Load Date]))'}>} [Monthly Issue ID]))
or you can use dimension's limit to restrict your chart to show only the top 10 values.
- Mark as New
- Bookmark
- Subscribe
- Mute
- Subscribe to RSS Feed
- Permalink
- Report Inappropriate Content
HI Sunny: That calculation did not work, it is still showing all lines and all values, not just the top 10.
I cant use Dimension Limits, since this is a straight table and Dimension limits are only available to me in graphs.
- Mark as New
- Bookmark
- Subscribe
- Mute
- Subscribe to RSS Feed
- Permalink
- Report Inappropriate Content
Would you be able to share your qvw?
- Mark as New
- Bookmark
- Subscribe
- Mute
- Subscribe to RSS Feed
- Permalink
- Report Inappropriate Content
I have just created a sample QV, I cannot share the original, as it has proprietary information.
- Mark as New
- Bookmark
- Subscribe
- Mute
- Subscribe to RSS Feed
- Permalink
- Report Inappropriate Content
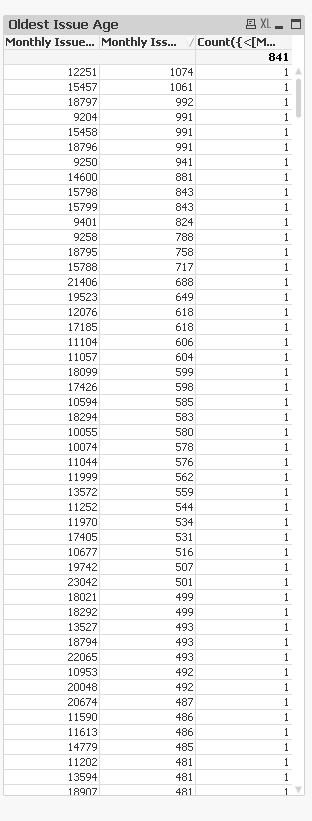
Each of the row is Count(.....) = 1... what is top 10 here?
- Mark as New
- Bookmark
- Subscribe
- Mute
- Subscribe to RSS Feed
- Permalink
- Report Inappropriate Content
Hi,
You can use "Dimension Limits" to show only top 10.
- Mark as New
- Bookmark
- Subscribe
- Mute
- Subscribe to RSS Feed
- Permalink
- Report Inappropriate Content
Payal: I have tried that, it doesn't work, it still shows all.
Sunny: I am looking to show the Oldest 10 (Based on Issue Age).
- Mark as New
- Bookmark
- Subscribe
- Mute
- Subscribe to RSS Feed
- Permalink
- Report Inappropriate Content
Is this the goal?

- Mark as New
- Bookmark
- Subscribe
- Mute
- Subscribe to RSS Feed
- Permalink
- Report Inappropriate Content
Yes, exactly!! How did you get that?
- « Previous Replies
- Next Replies »