Unlock a world of possibilities! Login now and discover the exclusive benefits awaiting you.
- Qlik Community
- :
- All Forums
- :
- QlikView App Dev
- :
- Stuck with this Chart
- Subscribe to RSS Feed
- Mark Topic as New
- Mark Topic as Read
- Float this Topic for Current User
- Bookmark
- Subscribe
- Mute
- Printer Friendly Page
- Mark as New
- Bookmark
- Subscribe
- Mute
- Subscribe to RSS Feed
- Permalink
- Report Inappropriate Content
Stuck with this Chart
Hi Community,
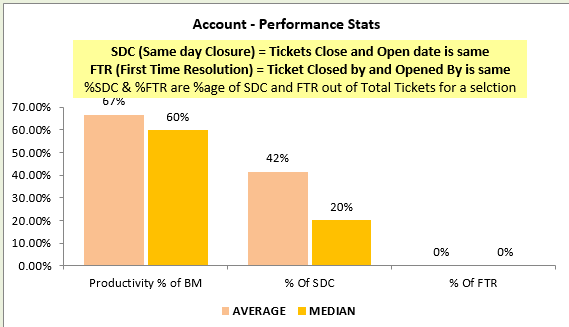
I have to create the below chart in Qlikview with the dimensions which are not actually part of any table ( %SDC & % FTR).
But the logic to arrive is given in the below screen shot. and chart should to dynamically change when we select any Date or any other filters used in the Dashboard. kindly suggest how to achieve this.
- Tags:
- charts
- Mark as New
- Bookmark
- Subscribe
- Mute
- Subscribe to RSS Feed
- Permalink
- Report Inappropriate Content
You Create an inline table with a column having %SDC,%FTR and %of BM and use it in the dimension of the chart.
In the expression use conditional function to use the SDC/FTR formulas respectively
- Mark as New
- Bookmark
- Subscribe
- Mute
- Subscribe to RSS Feed
- Permalink
- Report Inappropriate Content
Hi Malini, thanks for the reply.
I have used the below condition, but only %SDC bar is appearing.
If(List='% of SDC',Median({<No_Days = {'00'}>} Ticketno),
If(List='% of FTR',Median({<[Openedby] = {[Closedby]}>} Ticketno)))
Not sure where it went wrong !
Openedby and Closedby are the column names.
- Mark as New
- Bookmark
- Subscribe
- Mute
- Subscribe to RSS Feed
- Permalink
- Report Inappropriate Content
Hi,
you can create a calculated dimension as: Valuelist('% SDC', '% FTR')
then in expression:
if( Valuelist('% SDC', '% FTR')='% SDC', expression for % SDC, expression for % FTR)
KR,
Elena