Unlock a world of possibilities! Login now and discover the exclusive benefits awaiting you.
- Qlik Community
- :
- All Forums
- :
- QlikView App Dev
- :
- Re: Sum equation versus Sum rows in straight table
- Subscribe to RSS Feed
- Mark Topic as New
- Mark Topic as Read
- Float this Topic for Current User
- Bookmark
- Subscribe
- Mute
- Printer Friendly Page
- Mark as New
- Bookmark
- Subscribe
- Mute
- Subscribe to RSS Feed
- Permalink
- Report Inappropriate Content
Sum equation versus Sum rows in straight table
Hi all
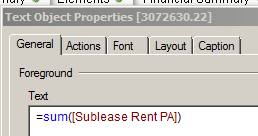
I have had a look round the boards but can't see anything that might help me with the current issue I am having. I am finding the =sum(FIELD) equation is (in some cases) multiplying figures but if I use a straight table and sum of rows it does not. Has anyone else come across this and does anyone have an idea why it might be doing it. Any help would be greatly appreciated this has been doing my head in for days.
Example:
- « Previous Replies
-
- 1
- 2
- Next Replies »
- Mark as New
- Bookmark
- Subscribe
- Mute
- Subscribe to RSS Feed
- Permalink
- Report Inappropriate Content
Hi - could be a few scenarios but a common one is this:
there may be data records in a table in the data model that report values for this numeric data field that belong to multiple dimension values, not just one.
The chart will total the same record into both dimension totals, but the overall total won't double count those when reporting the grand total.
A 'sum of rows' will ignore double counting possibilities and just add the pre-aggregated numbers from each row .
essentially the grand total aggregates from raw detail records. the sum of rows is a sum of pre-aggregates.
- Mark as New
- Bookmark
- Subscribe
- Mute
- Subscribe to RSS Feed
- Permalink
- Report Inappropriate Content
Thanks
I have checked the table and the number of rows is exactly the same as what the straight table is showing. And unfortunately this is not the only field I have having this issue on, this one is multiplying by 4 but I have one that multiplies by 16 (in a different document).
- Mark as New
- Bookmark
- Subscribe
- Mute
- Subscribe to RSS Feed
- Permalink
- Report Inappropriate Content
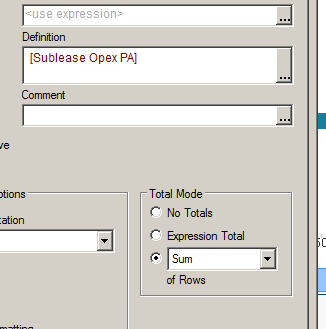
Hi Bella,
In the example you have pictured you have no aggregation expression around the Field. In this instance values will only show if there is only one value for a dimension - otherwise null will show. Also, if the same value appears multiple times it will only show once - it will not add up.
Whenever you have an expression you should pretty much always have an aggregation such as Sum around it.
Once you do this I would expect that Expression total will give you the correct value.
If it does not then it is the same value appearing against more than one of the dimensions, as Jonathan states. This can be caused by a broken association.
(Also, I note in your screen grabs you are looking at two different fields, is this correct?)
Hope that helps,
Steve
- Mark as New
- Bookmark
- Subscribe
- Mute
- Subscribe to RSS Feed
- Permalink
- Report Inappropriate Content
To further illustrate why you need to have aggregations on your expressions, I've attached a small app.
You will notice that where there are two different values for dimension B these do not show or calculate correctly without the aggregation. The sum of rows give a wrong result.
If you put the aggregation on the expression then all is well, and in this case whether you use sum of rows or expression total doesn't matter as you get the same result.
Where sum of rows can come in handy is when your expression is an average and you then want to get the total of those averages. Not that this is a very common use case, to be honest.
Steve
- Mark as New
- Bookmark
- Subscribe
- Mute
- Subscribe to RSS Feed
- Permalink
- Report Inappropriate Content
Thanks Steve but the figure in the straight table is the correct one, the one that is wrong is the one in the text box with the sum(FIELD) equation. All the numbers in the straight table are linked to the key so they don't ignore duplicates.
I screenshot the wrong thing the fields are the same
- Mark as New
- Bookmark
- Subscribe
- Mute
- Subscribe to RSS Feed
- Permalink
- Report Inappropriate Content
Thanks I'll have a look at that
- Mark as New
- Bookmark
- Subscribe
- Mute
- Subscribe to RSS Feed
- Permalink
- Report Inappropriate Content
Hi Bella,
The one on the left is simply a table box. You can not do any calculations or totals on a table box (in fact they tend not to be much use at all) they just show the values in the underlying data - removing any duplicate rows.
If you need to see each of the individual values then you need to ensure that you have a unique ID on the row, such as a TransactionID (or a combination, such as Order Time and Customer Name together).
If you don't have a unique key you can add one at load time with the RowNo() function, like this:
LOAD
RecNo() as UniqueID,
Value,
etc...
This will simply add a counter you can add to your tables to ensure every row is shown. I would certainly use a Straight Table chart with an aggregation on it and add the UniqueID. If you don't want anyone to see the unique ID this can be suppressed by clicking Hide on the Presentation tab.
Hope that helps,
Steve
- Mark as New
- Bookmark
- Subscribe
- Mute
- Subscribe to RSS Feed
- Permalink
- Report Inappropriate Content
Thanks Steve for the attempt but I think I may have to write this one off for the moment and hope that something I try at some point fixes it cos everything you have said is the case for me.
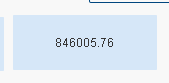
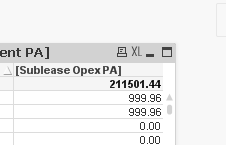
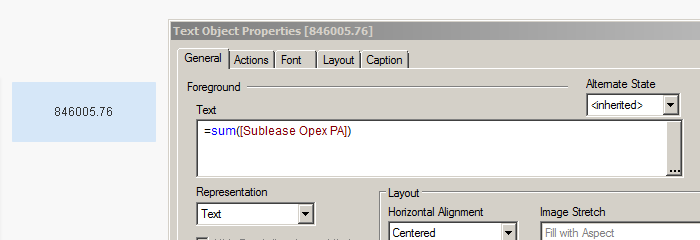
I'm using a straight table with a key so I am getting the sum of individual information. The problem is when I use the sum(FIELD) equation as an expression in a chart or text box it is multiplying the data
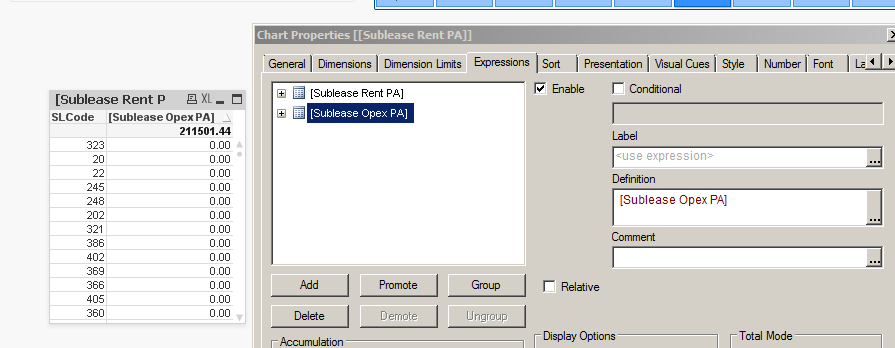
The above figure of 211501.4 is correct (I have checked the base database) but the below is what I get when I use sum as an experession
I have checked the rows in the table and they aren't duplicated, I have checked the SQL and removed any external table references (which I have found duplicated data before)
- Mark as New
- Bookmark
- Subscribe
- Mute
- Subscribe to RSS Feed
- Permalink
- Report Inappropriate Content
Hi Bella,
Do you have any JOIN statements anywhere (either SQL or QlikView) as these can cause duplicate rows, as you say.
If you look in the table viewer (File \ Table Viewer) and hover over the table with these data in, do you get the count of rows you expect?
You can also do a count of rows by adding a counter field to each row, like this:
LOAD
1 as MyCounter,
[Sublease Opex PA],
etc.
You can then add an expression to your straight table of sum(MyCounter) and it will tell you how many rows of source data you have for each row in the straight table. I think there may be more than you expect.
Steve
- « Previous Replies
-
- 1
- 2
- Next Replies »