Unlock a world of possibilities! Login now and discover the exclusive benefits awaiting you.
- Qlik Community
- :
- All Forums
- :
- QlikView App Dev
- :
- Re: Sum if accumulated value is n% of Total
- Subscribe to RSS Feed
- Mark Topic as New
- Mark Topic as Read
- Float this Topic for Current User
- Bookmark
- Subscribe
- Mute
- Printer Friendly Page
- Mark as New
- Bookmark
- Subscribe
- Mute
- Subscribe to RSS Feed
- Permalink
- Report Inappropriate Content
Sum if accumulated value is n% of Total
Hi, I have one field [Volume] and I would like to sum rows only if them, once sorted from biggest to smallest, are n% of Total [Volume].
I found this function in chart and it works perfectly.
How can I get it Text Expression?
Suppose I have:
| Fruit | Volume | Rank |
|---|---|---|
| Bananas | 250 | 2 |
| Apples | 400 | 1 |
| Pears | 50 | 5 |
| Peaches | 200 | 3 |
| Plums | 100 | 4 |
Total [Volume] = 1000
I would like to sum only top values within 70% of Total Volume.
Expected result should be:
650
(Apples, 400 + Bananas 250, the first / top 2 values that if summed are <= 70% of Total)
Accepted Solutions
- Mark as New
- Bookmark
- Subscribe
- Mute
- Subscribe to RSS Feed
- Permalink
- Report Inappropriate Content
Hi,
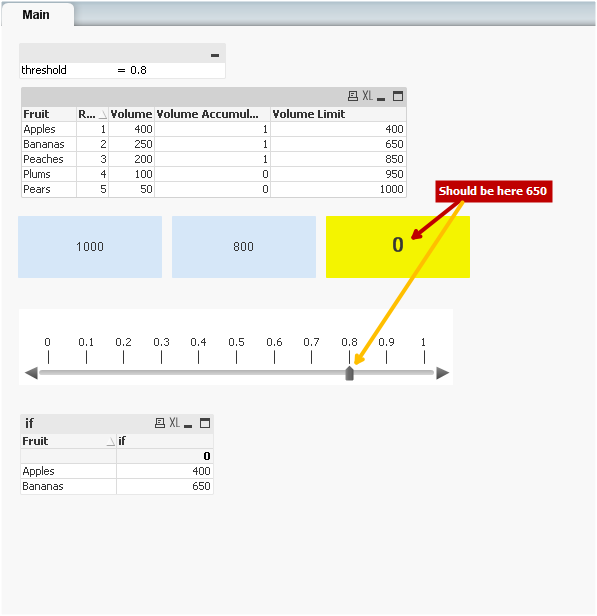
Attached a solution with a variable table that gets what you need Clemente.
Theres a slider on the right side that lets you see which values are greater than the total volume value multiplied by the threshold.
- Mark as New
- Bookmark
- Subscribe
- Mute
- Subscribe to RSS Feed
- Permalink
- Report Inappropriate Content
Hi Clemente,
You could do something like the code below:
//let threshold = 0.7;

// loads data
data:
load * Inline
[
Fruit,Volume,Rank
Bananas,250,2
Apples,400,1
Pears,50,5
Peaches,200,3
Plums,100,4
];

// get the sum of all, as to get the total vloume
sum:
Load
sum(Volume) as [Total Volume]
Resident data;

// creates variable to get the total amount
let limitVolume = peek('Total Volume',0,'sum');


drop table sum;

// orders the data based on rank and volume values and checks if the aggregated sum is greater than the threshold
NoConcatenate
orderedData:
Load *,
if([Volume Limit]>$(limitVolume)*$(threshold),0,1) as [Volume Accumulate Threshold];
Load *,
Alt(peek([Volume Limit]),0)+Volume as [Volume Limit]

Resident data
order by Rank,Volume;


drop table data;
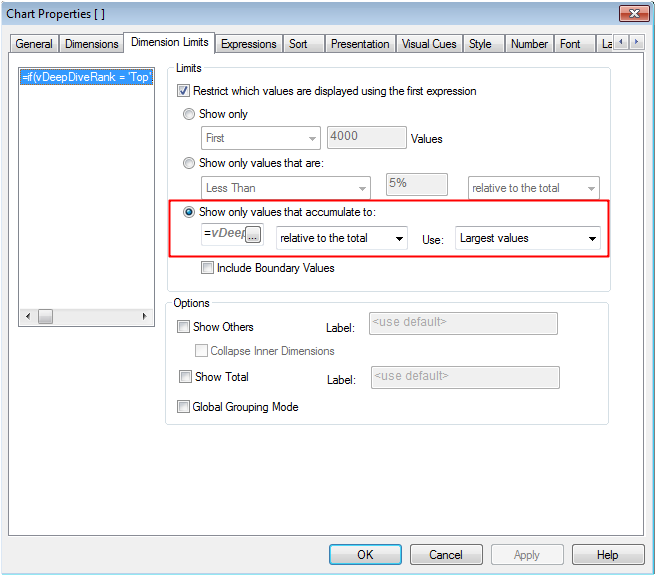
As expression, simply use the [Volume Accumulate Threshold] field in the set analysis, getting the following:
You can change the threshold variable to the limit you want, and get the according values, I've put to 0.9 (90% of limit) and got the sum of the corresponding values.
Attached the QVW used.
- Mark as New
- Bookmark
- Subscribe
- Mute
- Subscribe to RSS Feed
- Permalink
- Report Inappropriate Content
Thank you so much for your reply Felip. I understood logic behind, brilliant. But what about having it in a textbox formula? I mean, it should be great if you could have threshold selected by user and dynamically formula applied. Without re-launching set analysis.
What about a formula like:
SUM({<Fruit={"=max(aggr(sum(Volume),Fruit),5))/sum(Total Volume)<=$(=Threshold)"}>}Volume)
Could you please validate / correct?
Thank you.
- Mark as New
- Bookmark
- Subscribe
- Mute
- Subscribe to RSS Feed
- Permalink
- Report Inappropriate Content
Hi,
Attached a solution with a variable table that gets what you need Clemente.
Theres a slider on the right side that lets you see which values are greater than the total volume value multiplied by the threshold.
- Mark as New
- Bookmark
- Subscribe
- Mute
- Subscribe to RSS Feed
- Permalink
- Report Inappropriate Content
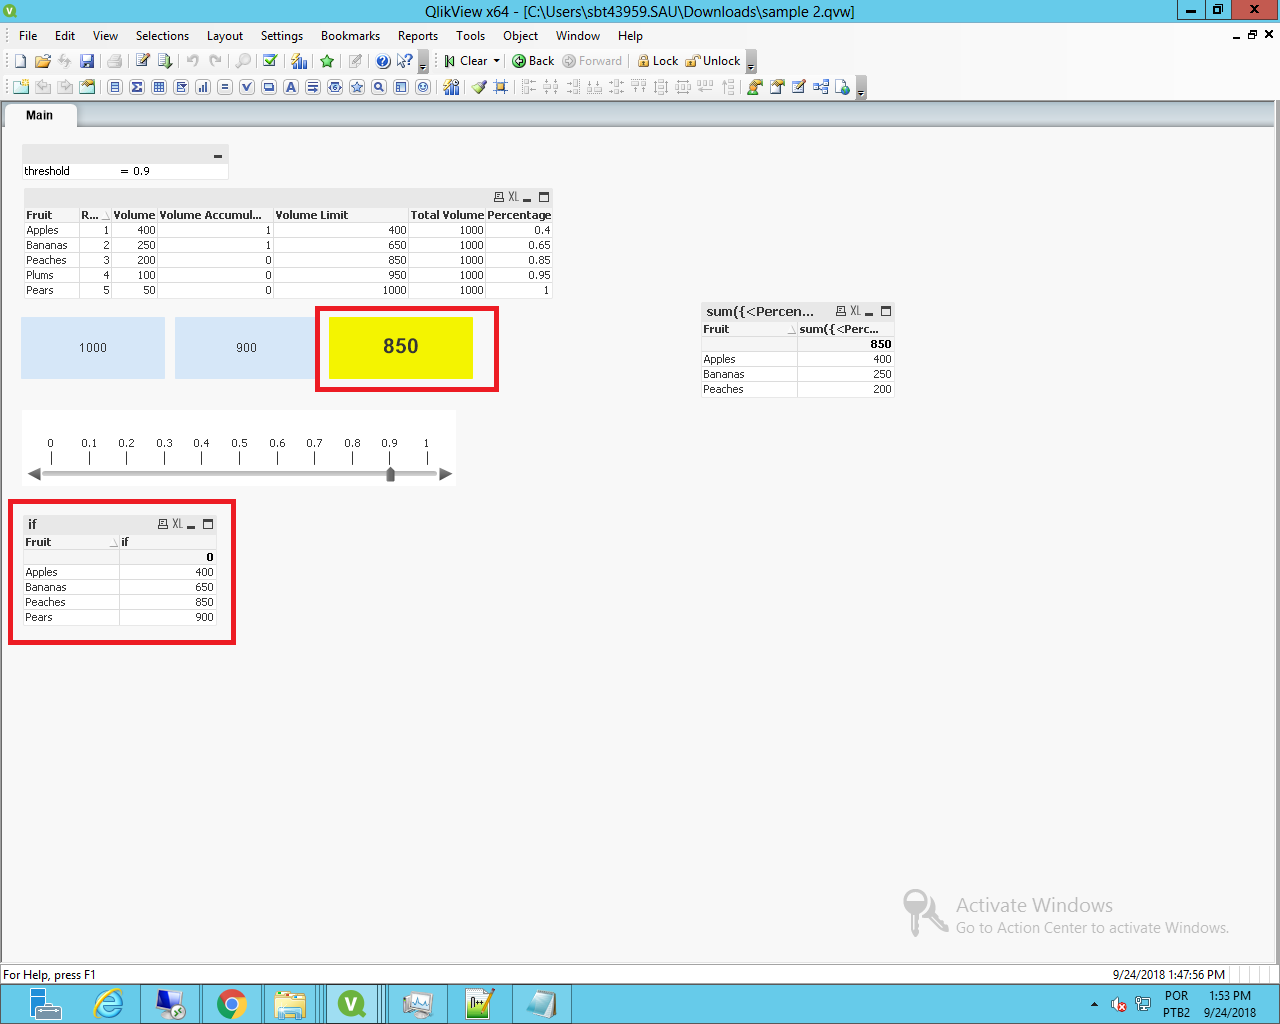
Hi Felip, thank you again, we are closer and closer. I used your helpful sample file to create a text box (in yellow, see also attached file + application). The goal is to have textbox with number. Slider is wonderful!
Thank you.
Clemente
- Mark as New
- Bookmark
- Subscribe
- Mute
- Subscribe to RSS Feed
- Permalink
- Report Inappropriate Content
Here it is application I forgot. Sorry.
- Mark as New
- Bookmark
- Subscribe
- Mute
- Subscribe to RSS Feed
- Permalink
- Report Inappropriate Content
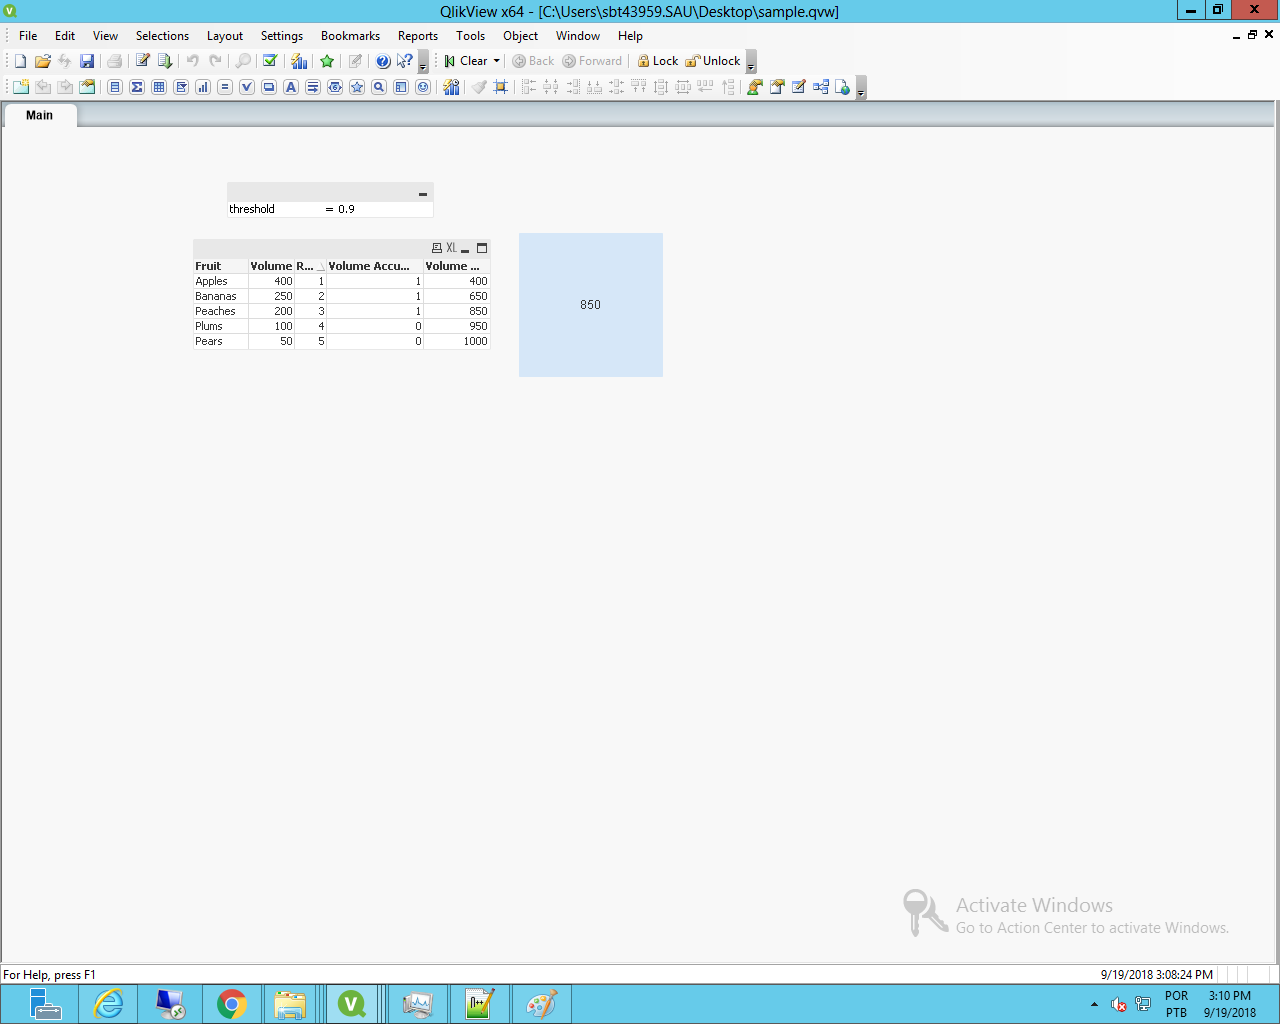
Problem with using the KPI format is that the above function wont work, since there's nothing to check above the current line being calculated.
That's whats done on the simple graph below, it sums up the above value, when on the "Bananas" row, and sums up the current row volume, getting the 400 of apple volume and 250 of bananas.
- Mark as New
- Bookmark
- Subscribe
- Mute
- Subscribe to RSS Feed
- Permalink
- Report Inappropriate Content
Hi Clemente,
See the attached solution for it.
Keep in mind that it necessarily needs a ranking position, based on the volume or any other metric, since its ordered that way to get the "Percentage" field.