Unlock a world of possibilities! Login now and discover the exclusive benefits awaiting you.
- Qlik Community
- :
- All Forums
- :
- QlikView App Dev
- :
- Sum of Account Balances of Top N accounts
- Subscribe to RSS Feed
- Mark Topic as New
- Mark Topic as Read
- Float this Topic for Current User
- Bookmark
- Subscribe
- Mute
- Printer Friendly Page
- Mark as New
- Bookmark
- Subscribe
- Mute
- Subscribe to RSS Feed
- Permalink
- Report Inappropriate Content
Sum of Account Balances of Top N accounts
Hi, I am trying to create the chart to show the sum of account balances of top N accounts. I need to create the below chart. If I select any date , I want show the chart like below:
Top 5 --> Sum of Top 5 Account Balances
Top 5 Accounts --> List of Accounts Top 5 Accounts List (EX: 2, 5, 8, 20, 4)
| TOP 5 | TOP 5 Account | Top 10 | Top 25 | Top 75 | |
| MonthEnd | |||||
| QTD | |||||
| PQTD | |||||
| P2QTD | |||||
| YTD |
Please find the attached sample QVD file for sample data.
- Mark as New
- Bookmark
- Subscribe
- Mute
- Subscribe to RSS Feed
- Permalink
- Report Inappropriate Content
Any Help ?
- Mark as New
- Bookmark
- Subscribe
- Mute
- Subscribe to RSS Feed
- Permalink
- Report Inappropriate Content
I didn't want to downloaded you data, sorry... See a simple example attached. It will be easy to apply the same rules to all your expressions.
- Mark as New
- Bookmark
- Subscribe
- Mute
- Subscribe to RSS Feed
- Permalink
- Report Inappropriate Content
Hi Mike Thanks for the reply. I am encountering two probelms.
1. I want show only 5 Accounts. Example for 12/13 it was showing 6 accounts. How to give the unique ranking if the rank value matching.
2. I want show MonthEnd (Total Month), QTD , PQTD (Previous Quarter) , P2QTD (Previous 2 Quarters) and YTD value for selected date
Please find the attached sample data.
- Mark as New
- Bookmark
- Subscribe
- Mute
- Subscribe to RSS Feed
- Permalink
- Report Inappropriate Content
hi dude,
Am attaching a doccument for only top 5 accoounts
- Mark as New
- Bookmark
- Subscribe
- Mute
- Subscribe to RSS Feed
- Permalink
- Report Inappropriate Content
I have very huge data and your expression went out of memory.
I am looking for how to give unique ranking if the value matching
- Mark as New
- Bookmark
- Subscribe
- Mute
- Subscribe to RSS Feed
- Permalink
- Report Inappropriate Content
Use Dimension limits and select show only 5 higest values
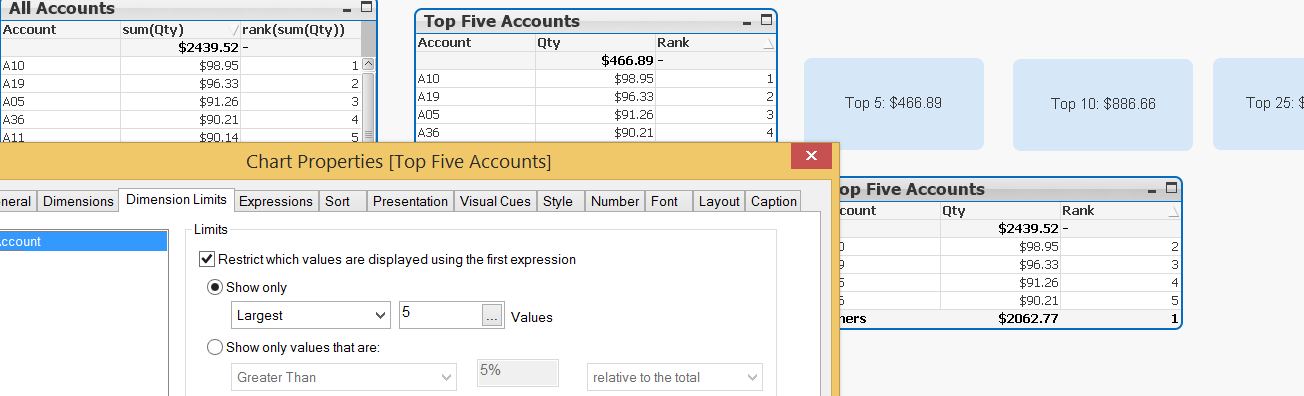
and remove selection "show others"
- Mark as New
- Bookmark
- Subscribe
- Mute
- Subscribe to RSS Feed
- Permalink
- Report Inappropriate Content
I want show Top 5 accounts in one cell value like : 10, 45, 67, 2, 23