Unlock a world of possibilities! Login now and discover the exclusive benefits awaiting you.
- Qlik Community
- :
- All Forums
- :
- QlikView App Dev
- :
- Sumarise a table of expressions into a matrix
- Subscribe to RSS Feed
- Mark Topic as New
- Mark Topic as Read
- Float this Topic for Current User
- Bookmark
- Subscribe
- Mute
- Printer Friendly Page
- Mark as New
- Bookmark
- Subscribe
- Mute
- Subscribe to RSS Feed
- Permalink
- Report Inappropriate Content
Sumarise a table of expressions into a matrix
Hi all,
I have created a table with two expressions calculated against a dimension. I now want to use the categories that are calculated in the expression to summarise. If I export hte tabel into Excel then it it really easy to create the summary. Is there a way that I can reference columns from a different table so that i can do this in QlikView?
The table I have is along the lines:
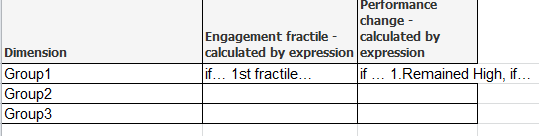
The engagement expression is:
=
If(sum([Hours])>Fractile (total aggr(sum([Hours]),[Group]),0.80), '1st fractile (top20%)',
If(sum([Hours])>Fractile (total aggr(sum([Hours]),[Group]),0.60), '2nd fractile',
If(sum([Hours])>Fractile (total aggr(sum([Hours]),[Group]),0.40), '3rd fractile',
If(sum([Hours])>Fractile (total aggr(sum([Hours]),[Group]),0.20), '4th fractile','5th fractile (bottom20%)'))))
The performance change expession is more complicated and includes variables so that different things can be selected here. It probably does not help to include it, but for completeness here it is:
if((((avg({<[Date]={"$(=vMax_date)"}>} $(vExpression_map2)))
-
(avg({<[Date]={"$(=vMin_date)"}>} $(vExpression_map2))))
/((vMax_date)-(vMin_date)))<=-1,'3.Declined',
if((((avg({<[Date]={"$(=vMax_date)"}>} $(vExpression_map2)))
-
(avg({<[DCS_Year]={"$(=vMin_date)"}>} $(vExpression_map2))))
/((vMax_date)-(vMin_date)))>=1,'2.Improved',
if((((avg({<[Date]={"$(=vMax_date)"}>} $(vExpression_map2)))
-
(avg({<[Date]={"$(=vMin_date)"}>} $(vExpression_map2))))
/((vMax_date)-(vMin_date)))=0 and avg($(vExpression_map2))>=3,'1.Remained High',
if((((avg({<[Date]={"$(=vMax_date)"}>} $(vExpression_map2)))
-
(avg({<[Date]={"$(=vMin_date)"}>} $(vExpression_map2))))
/((vMax_date)-(vMin_date)))=0 and avg($(vExpression_map2))<=2,'4.Remained Low',))))
The summary structure I would like is:
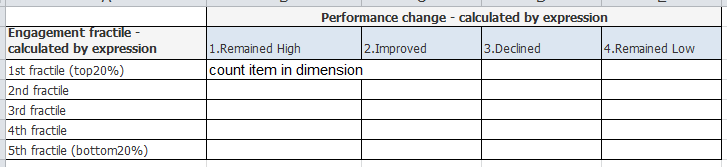
Anyideas?
Many thanks,
Isabel
- Mark as New
- Bookmark
- Subscribe
- Mute
- Subscribe to RSS Feed
- Permalink
- Report Inappropriate Content
Is there a way that I can reference columns from a different table so that i can do this in QlikView?
No, you can't reference columns or cells of other charts. What you can do is put your expressions in variables and (re)use those variables in the expressions in your charts.
talk is cheap, supply exceeds demand