Unlock a world of possibilities! Login now and discover the exclusive benefits awaiting you.
- Qlik Community
- :
- All Forums
- :
- QlikView App Dev
- :
- Re: Supplier Delivery Performance Analysis
- Subscribe to RSS Feed
- Mark Topic as New
- Mark Topic as Read
- Float this Topic for Current User
- Bookmark
- Subscribe
- Mute
- Printer Friendly Page
- Mark as New
- Bookmark
- Subscribe
- Mute
- Subscribe to RSS Feed
- Permalink
- Report Inappropriate Content
Supplier Delivery Performance Analysis
Hi
I am pretty new to Qlikview and am having to learn very fast with company changes and new measures (KPI's) - I have a very simple problem - I have 2 SQL tables which are joined ( easy bit ) - I now need to create some variables. First one is DueDate - ReceivedDate to give a number. I then want to be able to have a "variable number of days late/early" so that I can then have a percentage of OnTime/Eary/Late from this on selected suppliers. I have completed this without a problem within Crystal Reports - but would like to have something a little more "BI" .... ( the %age measures can be per supplier or per selection ( multiple suppliers! ) ) - Thanks in advance
Accepted Solutions
- Mark as New
- Bookmark
- Subscribe
- Mute
- Subscribe to RSS Feed
- Permalink
- Report Inappropriate Content
Hi DV,I have attached a sample of the data from Crystal - Report shows the summary I am trying to acheive.Regards
Steve
- Mark as New
- Bookmark
- Subscribe
- Mute
- Subscribe to RSS Feed
- Permalink
- Report Inappropriate Content
Hi Steve,
Do you have some sample data? One of us from the community can demostrate an example with your sample data. If you dont have - no worries... I'll mock up something as an example.
Cheers - DV
- Mark as New
- Bookmark
- Subscribe
- Mute
- Subscribe to RSS Feed
- Permalink
- Report Inappropriate Content
Hi DV,I have attached a sample of the data from Crystal - Report shows the summary I am trying to acheive.Regards
Steve
- Mark as New
- Bookmark
- Subscribe
- Mute
- Subscribe to RSS Feed
- Permalink
- Report Inappropriate Content
Hi Steve,
Please find attached sample QV document. Hope this is what you need. Do let me know if you anything else.
Hope this helps!
Cheers - DV
- Mark as New
- Bookmark
- Subscribe
- Mute
- Subscribe to RSS Feed
- Permalink
- Report Inappropriate Content
Hi Steve,
Have you got this working with my previous example? Let me know if you need more...
Cheers - DV
- Mark as New
- Bookmark
- Subscribe
- Mute
- Subscribe to RSS Feed
- Permalink
- Report Inappropriate Content
HI,Yes I managed to see the data and what you have acheived - but I think I need to rethink the data I have. I am linking 2 tables with the following Load Script;First Table ( One Date Field ), Second Table ( One Date Field ) - The calulation or Dimension that I am after is for the one field from another .... perhaps I am trying to overcomplicate things ?Steve
- Mark as New
- Bookmark
- Subscribe
- Mute
- Subscribe to RSS Feed
- Permalink
- Report Inappropriate Content
Hi DV,I have had a rethink on what I am trying to acheive. So have created a SQL view to make things easier within QV. The View now shows date calcs and my main goal would be to create an overview of the following ;Supplier, StockCode, Total Deliveries, Early Deliveries, Late Deliveries with %ages. The days tolerance of early and late would be slider bars at the top so that we can see the effect on haveing a 2 day or 4 day tolerance of late/early. I will ahve another go and let you know the outcome.
Regards
Steve
- Mark as New
- Bookmark
- Subscribe
- Mute
- Subscribe to RSS Feed
- Permalink
- Report Inappropriate Content
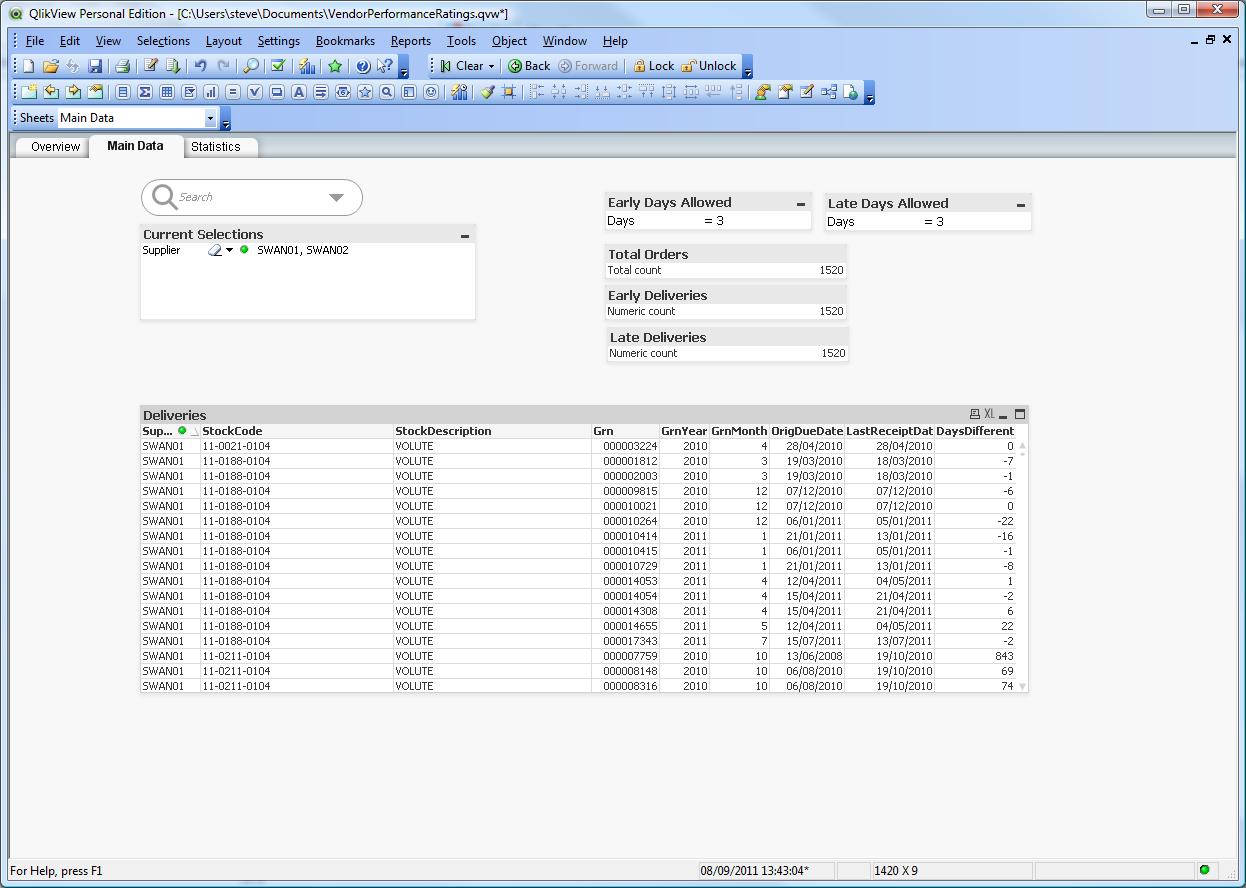
I have taken a screen dump of my goal - What I am trying to acheive is with my data analysis.... using a slider scale of days allowed late/early and update the table data below with "Early - more than n Days" or "Late - more than n Days" for each row.I would then need the 2 boxes of stats at the top to be updated to show out of 1520 deliveries, 300 early, 200 late and eventually %ages.Thanks in advance for your help.Steve