Unlock a world of possibilities! Login now and discover the exclusive benefits awaiting you.
- Qlik Community
- :
- All Forums
- :
- QlikView App Dev
- :
- Suppressing scrollbar in a chart when dimension op...
- Subscribe to RSS Feed
- Mark Topic as New
- Mark Topic as Read
- Float this Topic for Current User
- Bookmark
- Subscribe
- Mute
- Printer Friendly Page
- Mark as New
- Bookmark
- Subscribe
- Mute
- Subscribe to RSS Feed
- Permalink
- Report Inappropriate Content
Suppressing scrollbar in a chart when dimension option "Show all values" is true
Hello,
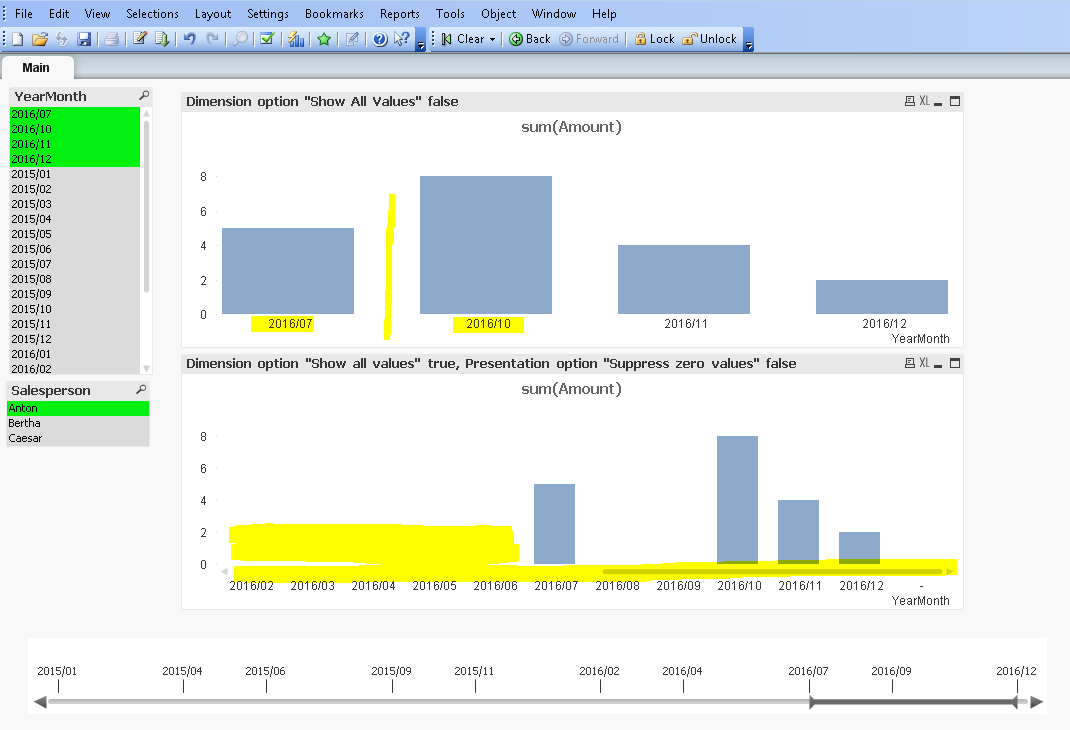
I have a chart with date (year/month) on X-axis and some calculated expressions (sum of amount, avg amount) on Y-axis. There are more year/month values in my data than can fit reasonably on the screen, so I enabled the scrollbar for the X-axis. There is no data for some year/months and I need to have the X-axis without “jumps” – for example even if there is no data to show for 2016/08 and 2016/09 I still need to have this two months on the dimension axis - so I set the Dimension option “Show all values” to true and the Presentation option “Suppress zero values” to false.
I would like to provide the users with a slider object for selecting a date range. If the user selects a date range that is smaller than the X-axis-scrollbar-threshold, the scrollbar should vanish. However, this happens only when the Dimension option “Show all values” is set to false, which is bad because of the “jumps” (non continuous values) on the X-axis (see the first chart in the attached screenshot). When the option “Show all values” is set to true, the scrollbar stays there and the Y-axis values for the now “unselected” X-axis values are not shown (second chart in the screenshot).
Any hints how to implement these seemingly conflicting requirements?
Thanks in advance
- Mark as New
- Bookmark
- Subscribe
- Mute
- Subscribe to RSS Feed
- Permalink
- Report Inappropriate Content
Maybe you could use two charts - one with scrollbar and the other without and controls their visibility (tab layout) with a condition like: count(distinct YearMonth) > YourScrollbarValue.
- Marcus
- Mark as New
- Bookmark
- Subscribe
- Mute
- Subscribe to RSS Feed
- Permalink
- Report Inappropriate Content
Thanks, but it would not work correctly - count(distinct YearMonth) returns the count of selected yearmonths only for which there is data - in the previous example (see screenshot), I selected 2016/07 to 2016/12, but as there is no data for August and September, count(distinct YearMonth) gives me 4 and not 6.
Edit: I could assign incremental numeric values to the YearMonth values so that I could get the lenght of the selected YearMonth-interval with Max(YearMonthCounter) - Min(YearMonthCounter) + 1, but it still does not solve my original problem: If I disable the scrollbar but still have the Dimension option "Show all values" = true and the Presentation option "Suppress zero values" = false, all possible YearMonth values will be shown on the X-axis.
- Mark as New
- Bookmark
- Subscribe
- Mute
- Subscribe to RSS Feed
- Permalink
- Report Inappropriate Content
Yes, you might need some max - min calculation to get the lenght of your interval to control the visibility properly. Further you are right, that it won't solve your original problem and I think it couldn't be done with something like this. Quite probably you will need for it to create the missing data: How to populate a sparsely populated field.
- Marcus
- Mark as New
- Bookmark
- Subscribe
- Mute
- Subscribe to RSS Feed
- Permalink
- Report Inappropriate Content
Yes, I think you are right. I wanted to avoid having to generate lots of pseudodata, but it is probably the only way. Thank you very much for your support.