Unlock a world of possibilities! Login now and discover the exclusive benefits awaiting you.
- Qlik Community
- :
- All Forums
- :
- QlikView App Dev
- :
- Synchronizing the scale of 2 bar charts
- Subscribe to RSS Feed
- Mark Topic as New
- Mark Topic as Read
- Float this Topic for Current User
- Bookmark
- Subscribe
- Mute
- Printer Friendly Page
- Mark as New
- Bookmark
- Subscribe
- Mute
- Subscribe to RSS Feed
- Permalink
- Report Inappropriate Content
Synchronizing the scale of 2 bar charts
I am looking to put together a couple of charts to display the outliers i.e. top 3 above the average and bottom 3 below the average.
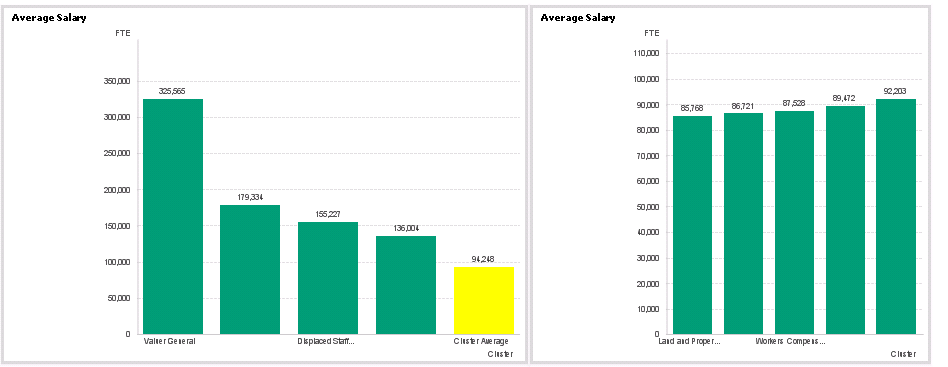
Here you see the problem, the scale of the 2 charts are not synchronized. The bottom ones that are on the right are supposed to have bars smaller than the average i.e. The cluster average in yellow. Can you advise how I can synchronize these 2 charts in terms of the scale?
Another question, I actually set out to show the positive outliers on the positive y axis and the negative outliers on the negative y axis, but since these are not actually negative values they don't display that way. Any trick to do that?