Unlock a world of possibilities! Login now and discover the exclusive benefits awaiting you.
- Qlik Community
- :
- All Forums
- :
- QlikView App Dev
- :
- Table Box - Help writing expression to sort data
- Subscribe to RSS Feed
- Mark Topic as New
- Mark Topic as Read
- Float this Topic for Current User
- Bookmark
- Subscribe
- Mute
- Printer Friendly Page
- Mark as New
- Bookmark
- Subscribe
- Mute
- Subscribe to RSS Feed
- Permalink
- Report Inappropriate Content
Table Box - Help writing expression to sort data

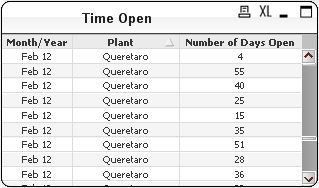
My data is made up of individual records, where each instance is a record. In the example I show below, you see the Plant name, "Queretaro" multiple times for the same month, e.g. Feb 12 - Queretaro, "", "", "", "". The only difference for each row item is that the Number of Days Open is different for each row item. *NOTE - there are multiple Plants besides Queretaro and the same output exists for those Plants, as well.
What I want to do: I would like to show one row for each plant p/month, e.g. Feb 12 - Queretaro, Feb 12 Plant "A", Feb 12 Plant "B", etc... Since we're wrapping the multiple rows into one per plant, per month, I'd like the AVERAGE of the quantity of "Number of Days Open". For instance, if there were 10 rows where Queretaro was listed for Feb 12 and the Number of Days Open was obviously different for each row as each row stands for an independant record, the schema would be the sum of all the different number of days open divided by 10 (the count of rows).
Can someone assist me with how to accomplish this? Do I sort by expression and if so, what type of expression? Do I need to do anything else, too?
Accepted Solutions
- Mark as New
- Bookmark
- Subscribe
- Mute
- Subscribe to RSS Feed
- Permalink
- Report Inappropriate Content
The expression should be avg({$<QP.SourceGroup={'Warranty'},QP.RootCauseGroup -= {'External Causes'}>} QP.NoOfDaysOpenNUM)
Remember to close the set analysis with a >} and get rid of the comma. You don't need to use *=, but -= can be used to exclude values.
Karl
- Mark as New
- Bookmark
- Subscribe
- Mute
- Subscribe to RSS Feed
- Permalink
- Report Inappropriate Content
Instead of a table box, create a chart that is a simple table. The dimensions would be month and plant and the expression would be avg([Number of Days Open])
Karl
- Mark as New
- Bookmark
- Subscribe
- Mute
- Subscribe to RSS Feed
- Permalink
- Report Inappropriate Content
Okay, now I'm getting closer, thanks. Next step involves "rules".
My Dimension is "Plant", so this is good. The Average function is working and outputting the average number of days open, however, there are records being included that should not be. The "rules" I mentioned refer to certain fields in each record, by which if a certain criteria is populated under a key field, the record should not be used in computing the Avg.
The Rules
Each record can be classified as a "Warranty" or "Non-Warranty" issue, and in my instance, I only want to include Warranty records in this metric. The classification of Warranty and Non-Warranty is in a group from my data source called, "QP.SourceGroup". So I believe my expression would have to include something like this, "([QP.SourceGroup])='Warranty'.
Additionally, each record is noted as to what the Root Cause of the issue was. In my instance, I wish to include ALL records except any records that fall within the Root Cause type, "External Causes". I have a group called "QP.RootCauseGroup", so my expression I believe I'd want to say to NOT INCLUDE ([QP.RootCauseGroup])='External Causes'.
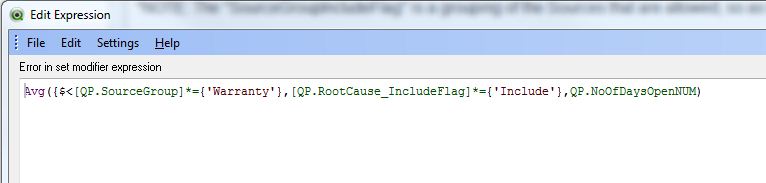
So here's what my current expression looks like, but it's not outputting any data so I must be doing something wrong. See below (also attached):
*NOTE: The "SourceGroup" is a grouping of the Sources and I'm trying to tell it to only take "Warranty" from within that grouping. The "RootCause_IncludeFlag" grouping includes all Root Causes EXCEPT "External Causes", so I'm guessing something is wrong with my formula.
- Mark as New
- Bookmark
- Subscribe
- Mute
- Subscribe to RSS Feed
- Permalink
- Report Inappropriate Content
The expression should be avg({$<QP.SourceGroup={'Warranty'},QP.RootCauseGroup -= {'External Causes'}>} QP.NoOfDaysOpenNUM)
Remember to close the set analysis with a >} and get rid of the comma. You don't need to use *=, but -= can be used to exclude values.
Karl
- Mark as New
- Bookmark
- Subscribe
- Mute
- Subscribe to RSS Feed
- Permalink
- Report Inappropriate Content
Karl, you da man! Thanks so much